Download
1 / 46
460 likes | 490 Vues
Explore the architecture of caBIG and caGrid, developed for the Cancer Research Community led by biologists and clinicians. Learn about tools, applications, and projects facilitating integrative cancer research, data sharing, infrastructure, and strategic planning. Discover the benefits of caBIG tools like caArray and Imaging Testbed for efficient data analysis and clinical support. Dive into the principles of caGrid, emphasizing open source, interoperability, and service-oriented architecture. Gain insights into Biomedical Information Objects and Common Data Elements vital for structured data reporting and controlled vocabulary in the cancer research domain.

E N D
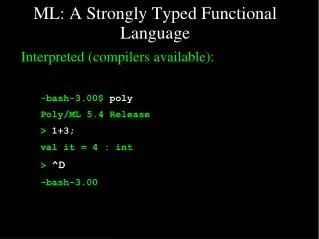
Architecture of a Strongly Typed Grid and Lessons Learned from the Cancer Research Community Joel Saltz MD, PhD Departments of Biomedical Informatics and Pathology
Overview • What is caBIG? • What is caGrid? • Brief overview of architecture and Tooling of caGrid • Example caBIG application • Potential links to petascale computing
Originated at NCI Biologists rather than computer scientists created caBIG program caBIG: Application community led effort
Clinical Trial Management Systems Addresses the need for consistent, open and comprehensive tools for clinical trials management. Provides tools and systems to enable integration and sharing of information. Integrative Cancer Research Provides for the integration, development, and implementation of tissue and pathology tools. Tissue Banks & Pathology Tools In vivo Imaging Provides for the sharing and analysis of in vivo imaging data. Vocabularies & Common Data Elements Responsible for evaluating, developing, and integrating systems for vocabulary and ontology content, standards, and software systems for content delivery. Architecture Developing architectural standards and architecture necessary for other workspaces. sharing of data, applications and infrastructure within the cancer community. Data Sharing and Intellectual Capital training in the use of the caBIG resources including on-line turtorials, workshops, training programs. Training Assists in identifying strategic priorities for the development and evolution of the caBIG effort. Strategic Planning caBIG Overview
Sample caBIG Project Areas Discovery Research • Challenge:A growing volume of increasingly complex data, but no system in place to collect, aggregate, analyze and distribute. • samplecaBIG™ Tools: • caArray • caWorkbench • webGenome • GenePattern • RProteomics • Proteomics LIMS • FunctionExpress • TrAPSS • Benefits: • Access to and integrated analysis of data from divergent sources • Increased efficiency in analyzing and visualizing results • Accelerated discovery of molecular signatures
caBIG Projects Imaging • Challenge:Existing systems provide no way to share or archive images to validate or facilitate diagnostics or prognostics.caBIG™ Tools: • Imaging Testbed • caIMAGE • National Cancer Imaging Archives • Benefits: • Digitized format enables information to be integrated with other molecular and clinical data • Improved clinical decision support – more accurate, objective and reproducible
caBIG Projects Infrastructure • Challenge:Lack of a common, connecting infrastructure requires every institution to duplicate data, applications and infrastructure • caBIG™ Product: • caGrid • caCORE • caDSR • EVS • LexGrid • Benefits: • Efficient use of limited resources • Appropriate access to key resources throughout the cancer enterprise • Communities knowledge is electronically accessible
caGrid Overview • Requirements: • Support scientific requirements: Use cases from cancer research community • Support functional requirements: identifiers, workflow, query, etc • Support non-functional requirements: security, reliability, performance, etc • Principles: • Driven by cancer research community requirements • caBIG Principles • Open Source, Open Access, Open Development • Federated • Syntactic and Semantic Interoperability • Services-Oriented Architecture • Metadata driven and implements Virtualization • Standards based
Focus on three notable features • Metadata management: infrastructure, curation • Tooling to help users produce new grid services and clients • Security (no time for details but crucial and controversial feature of biomedical grid)
Biomedical Information Objects • Data service infrastructure developed using OMG’s Model Driven Architecture approach • Object models expressed in UML represent actual biomedical research entities such as genes, sequences, chromosomes, sequences, cellular pathways, ontologies, clinical protocols, etc. • The object models form the basis for uniform APIs (Java, SOAP, HTTP-XML, Perl) that provide an abstraction layer and interfaces for developers to access information without worrying about the back-end data stores biomedical objects common data elements controlled vocabulary
Common Data Elements • Structured data reporting elements • Precisely defining the questions and answers • What question are you asking, exactly? • What are the possible answers, and what do they mean? biomedical objects common data elements controlled vocabulary
Enterprise Vocabulary • NCI Meta-Thesaurus (Cross-map standard vocabularies/ontologies, e.g. SNOMED, MEDRA, ICD) • Semantic integration, inter-vocabulary mapping • UMLS Metathesaurus extended with cancer-oriented vocabularies • 800,000 Concepts, 2,000,000 terms and phrases • Mappings among over 50 vocabularies • NCI Thesaurus • Description logic-based • 18,000 “Concepts” • Concept is the semantic unit • One or more terms describe a Concept – synonymy • Semantic relationships between Concepts biomedical objects common data elements controlled vocabulary
Formal semantic curation process (George Komatsoulis)
Introduce: Tooling to help users produce new grid services and clients • A framework which enables fast and easy creation of caGrid compatible services whether they are data, analytical, custom, or core services. • Provide easy to use graphical service authoring tools. • Hide all “grid-ness” from the developer so that they can concentrate on the domain expert implementation. • Utilize best practice layered grid service architectures. • Handle all service architecture requirements of the caGrid. • Strong service interface data typing • Metadata and service registration • Grid security integration
Introduce • Requirements • Basic strongly typed grid requirements plus semantically interoperable caBIG requirements • Architecture • Grid service framework which is encapsulated and layered on Globus • Introduce Toolkit • Enables easy development of caBIG compliant grid service
Addressing the Requirements • Tool providers will describe the grid service interface they wish to provide. • Clients will do not need to be aware of any implementation specific details of the grid service • Introduce will enable schema extraction from a GME so that the wsdl, beans, and service metadata can be automatically populated so the service will be using strongly typed and publicly accessible data types • Build process will automatically generate a client side object oriented API • We will generate a wrapper for this API which matches the service interface to make a clean mapping from client to service.
Introduce Service Creation/Modification Tool • Graphical tool to automatically create source code, configuration files, and build process for new analytical services • Developer defines the operations of the service and just has to focus on the implementation of them • Generated service is caBIG compliant in its mechanisms to register, advertise, and secure
Introduce Service Creation/Modification Tool cont. • Input and output parameters can be discovered from GME or caDSR • Schema types can be automatically downloaded and configured as operation parameters • Specified types are used to create necessary Java Objects using Axis/Globus behind the scenes
Created Skeleton Layout = generated = built = developers contribution
Available data services DICOM image viewer Queried results Click to browse images, submit CAD analysis, and view results Example Application: Remote execution of multiple Image Analysis algorithms using multiple image databases • Facilitate research and clinical decision support with large number of subjects and multiple image analysis algorithms. • Enable better algorithm development and validation through the use of many distributed, shared image datasets • Support remote algorithm execution – reduce data transfer and avoid the need to transmit PHI
gridIMAGE Architecture Expose algorithms, human markup and image data as caGrid Services
Image Data Service • Expose data in DICOM PACS servers as caGrid Data Service • XML based data transfer (our own schema) • caDSR CDE
Image Analysis Application Service • caGrid middleware to wrap image analysis applications with grid services • Interact with Data Services to retrieve images • Invoke algorithm with required inputs • Transform and report results to results data service
Human Markup Services • Query a work-order queue to retrieve any new markup requests • Interact with Data Services to retrieve images • Capture markups and save to results data service
ACRIN Image Archive • 14 million images since 1999 • 16 Terrabytes of storage • All images from all trials stored at HQ • Images re-transmitted from HQ to selected investigators for: • Quality assurance (QA plan specific to each trial) • Off-line reader studies • HQ laboratories for on-site image manipulation and interpretation • Imaging Lab • PET Core Lab
Links to Petascale Computing:Dataset Size Basic small mouse is 10 cm3 1 μ resolution – very roughly 1013 bytes/mouse Molecular data (spatial location) multiply by 102 Vary genetic composition, environmental manipulation, systematic mechanisms for varying genetic expression; multiply by 103 Total: 1018 bytes per big science animal experiment Data drives complex computational pipelines
Wild vs Mutant Wild type - Labyrinth neat, well-ordered, maternal blood sinusoids and trophoblasts evenly dispersed among fetal blood cells. Mutant - Trophoblasts grow wildly, clump together and disrupt fetal and maternal cells layers necessary for proper embryonic growth
Tumor Microenvironment • Cancer is a complex phenomenon • A tumor is an organ • Structural and functional differentiation within tumor • Molecular pathways are time and space dependent • “Field effects” – gradient of genetic, epigenetic changes • Anatomy, physiology, molecular biology of cancer
Tumor microenvironment research: True Multiscale Information Integration
Compare phenotypes of normal vs Rb deficient mice Alignment Slides/Slices Placenta Visualization Segmentation
Approach: link fine grain (MPI based) parallel component support to caGrid: DataCutter • Pipeline with sequence image normalization, segmentation, registration, feature detection routines • caGrid/DataCutter/Matlab • Workflow optimization testbed • DDDAS NSF project with ISI • Application to urgent computing
Lessons Learned • Applications community-driven large scale grid effort (and possibly petascale computing) • Cancer research consists of many types of conceptually interconnected application areas • Going from conceptual links to joins requires major retooling in each application area as well as federated database/distributed processing “grid” infrastructure • Data modeling/metadata plays central role • Ease of grid development, security necessary (but sufficient?)
Open issues • Will cancer researchers broadly adopt this infrastructure? • If the infrastructure is broadly adopted, will it lead to increased research productivity? • How should a community go about standardizing/curating metadata – is caBIG approach scalable? • Can caGrid serve as front end for integrated Grid/High end computing infrastructure (once called “metacomputing”
Ohio State University - Department of BioMedical Informatics(http://bmi.osu.edu/) Dave Ervin Shannon Hastings Tahsin Kurc Stephen Langella Scott Oster Joel Saltz Argonne National Lab / University of Chicago(http://www.globus.org) William Allcock Jarek Gawor Ravi Madduri Frank Siebenlist Michael Wilde Duke University A. Jamie Cuticchia Patrick McConnell Georgetown University Colin Freas Paul A. Kennedy Chad La Joie SAIC(http://www.saic.com) Manav Kher Booz | Allen | Hamilton (http://www.bah.com) Arumani Manisundaram Michael Keller Reechik Chatterjee caGrid Team
gridCAD Team Tony Pan, Joel Saltz, Tahsin Kurc, Stephen Langella, Shannon Hastings, Scott Oster, Ashish Sharma, Metin Gurcan Department of Biomedical Informatics The Ohio State University Medical Center, Columbus OH Eliot Siegel, Khan M. Siddiqui University of Maryland School of Medicine, Baltimore, MD For more information, please contact Tony Pan (tpan@bmi.osu.edu) Dept. of Biomedical Informatics, The Ohio State University http://bmi.osu.edu
Microscopy Image Analysis • Biomedical Informatics • Tony Pan • Alexandra Gulacy • Dr. Metin Gurcan • Dr. Ashish Sharma • Dr. Kun Huang • Dr. Joel Saltz • Computer Science and Engineering • Raghu Machiraju • Kishore Mosaliganti • Randall Ridgway • Richard Sharp • Human Cancer Genetics • Pamela Wenzel • Dr. Gustavo Leone • Dr. Alain deBruin • Dr. Tony Trimboli Jana Opavska
OSU Epigenetics Integrated Cancer Biology Center caBIG Group (Informatics Core) Joel H. Saltz, Junghee Han, Hao Sun, Pearlly Yan, Ramana Davuluri, and Tim Huang (PI)
GridCAD Acknowledgements The RIDER dataset used during this demonstration is provided courtesy of NCI Cancer Imaging Program iCAD Inc.: Euvondia Friedmann, Maha Sallam, Tim Carter This project was funded by NIH BISTI Center for Grid Enabled Medical Imaging, NCI, NSF, and the State of Ohio Board of Regents BRTT program For more information, please contact Tony Pan (tpan@bmi.osu.edu) Dept. of Biomedical Informatics, The Ohio State University http://bmi.osu.edu