Download
1 / 2
20 likes | 145 Vues
EU strengths in R&D by firms. Research activities within the Industrial Research and Innovation (IRI) action cover, among other issues, the impact and determinants of corporate R&D. The target audience is mainly the scientific community and policy-makers at all levels of governance.

E N D
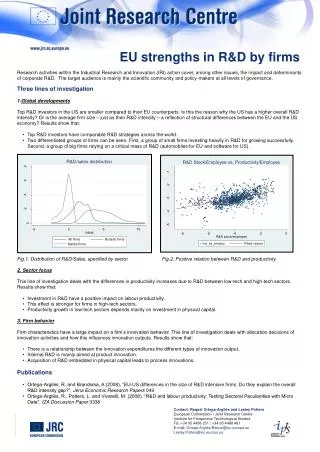
EU strengths in R&D by firms • Research activities within the Industrial Research and Innovation (IRI) action cover, among other issues, the impact and determinants of corporate R&D. The target audience is mainly the scientific community and policy-makers at all levels of governance. • Three lines of investigation • Global developments Top R&D investors in the US are smaller compared to their EU counterparts. Is this the reason why the US has a higher overall R&D intensity? Or is the average firm size – just as their R&D intensity – a reflection of structural differences between the EU and the US economy? Results show that: • Top R&D investors have comparable R&D strategies across the world. • Two differentiated groups of firms can be seen. First, a group of small firms investing heavily in R&D for growing successfully. Second, a group of big firms relying on a critical mass of R&D (automobiles for EU and software for US). Fig.1: Distribution of R&D/Sales, specified by sector Fig.2: Positive relation between R&D and productivity 2. Sector focus This line of investigation deals with the differences in productivity increases due to R&D between low-tech and high-tech sectors. Results show that: • Investment in R&D have a positive impact on labour productivity. • This effect is stronger for firms in high-tech sectors. • Productivity growth in low-tech sectors depends mainly on investment in physical capital. 3. Firm behavior Firm characteristics have a large impact on a firm’s innovation behavior. This line of investigation deals with allocation decisions of innovation activities and how this influences innovation outputs. Results show that: • There is a relationship between the innovation expenditures the different types of innovation output. • Internal R&D is mainly aimed at product innovation. • Acquisition of R&D embedded in physical capital leads to process innovations. • Publications • Ortega-Argilés, R. and Brandsma, A.(2008), “EU-US differences in the size of R&D intensive firms: Do they explain the overall R&D intensity gap?”, Jena Economic Research Papers 049 • Ortega-Argilés, R., Potters, L. and Vivarelli, M. (2008). “R&D and labour productivity: Testing Sectoral Peculiarities with Micro Data”, IZA Discussion Paper 3338 Contact: Raquel Ortega-Argilés and Lesley Potters European Commission • Joint Research Centre Institute for Prospective Technological Studies Tel. +34 95 4488 251 / +34 95 4488 461 E-mail: Ortega-Argilés.Raquel@ec.europa.eu Lesley.Potters@ec.europa.eu
NOTES 1. Poster Title • Replace the mock-up text of the poster title (”Joint Research Centre”) with the text of your own title. • Keep the original font colour (100c 80m 0y 0k). • Keep the flush-right justification. • Set it in Helvetica Rounded Bold Condensed, if you own the typeface. Otherwise, in Arial, Helvetica or Verdana – plain or bold. • Keep the original font body size (102 pt or, preferably,120 pt) and the title on a single line whenever possible. Reduce the body size and/or set the title on more than one line only if unavoidable. 2. Poster Subtitle • Replace the mock-up text of the poster subtitle (”Place Your Poster Subtitle Here”) with the text of your own subtitle. • Keep the original font colour (black). • Keep the flush-right justification. • Set it in MetaPlusBook-Roman, if you own the typeface. Otherwise, in Arial, Helvetica or Verdana. • Keep the original font body size (72 pt) and the subtitle on a single line whenever possible. Reduce the body size and/or set the subtitle on more than one line only if unavoidable. • If your poster does not have a main subtitle, delete the subtitle mock-up text or its text-box altogether. 3. Poster Main Text and Illustrations • Replace the mock-up text of the poster with your own text. Keep it within the boundaries of the two main-text boxes provided. • Keep the original font colour (black). • Should you need a second colour within your text, use the same one of the poster title (100c 80m 0y 0k). • Keep the flush-left justification. • Set the main text in MetaPlusBook-Roman and the section headings in MetaPlusBold-Roman, if you own the typefaces. Otherwise, the main text in Arial, Helvetica or Verdana, and the section headings in their respective bold weights. • Adjust the font body size and leading to the needs of your own text, depending on its overall length, for optimal display and legibility. • Should you need a second level of text, set it in a smaller body size than that of your main text (and, in the case of photo captions, in italics, too). • Place your illustrations (pictures, graphs, etc.) within the boundaries of the two main-text boxes. Adjust your text-flow as needed. 4. Contact Box • Replace the mock-up contents of the contact box with your own data. • Keep the contact box in place if possible. Place it elsewhere only if unavoidable for layout reasons, but in that case try, at least, to align it with some main element of the poster. 5. Additional Logos • Should you need to display additional logos (e.g., of partner organizations or universities), reduce or enlarge them to a height within those of the JRC logo and the Directorate or Institute logo. • Place any additional logos on the bottom of the poster, evenly spaced between the JRC and (if there is one) the Directorate or Institute logo, and vertically centred with them. • Ortega-Argilés, R. and Brandsma, A.(2008), “EU-US differences in the size of R&D intensive firms: Do they explain the overall R&D intensity gap?” JERP 049. • Presented at the CONCORD’07 (Seville, Spain) • Presented at the Max Planck Institute of Economics (Jena, Germany) • Presented at the Knowledge for Growth: European Strategies in the Global Economy (Toulouse, France). • Under review process in a peer-reviewed journal Abstract: R&D intensity is higher in the US than in the EU. Moreover, the average firm size of the R&D-performers among US-based companies is smaller than of the EU-based firms. Does this explain why the US has a greater R&D intensity, or is the average firm size just as their R&D intensity a reflection of the differences in the sectoral composition of output between the EU Member States and the US? Using a panel of the top-R&D world investors from the 2006 EU Industrial R&D Investment Scoreboard, the size differential between R&D-performers in EU and US is examined. Our analysis shows a reversal of Schumpeter's critical mass theory in the US case. Some policy relevant interpretations can be derived from our analysis. Differences in the size distribution of firms have been singled out by some analysts as the main cause of the difference in R&D intensity between world regions. European policy-makers complained that their firms were too small to compete technologically with large American companies around the 60s and in recent years similar concerns have been raised by US policymakers regarding competition from innovative companies in Japan and other regions. This is not borne out by our study of panel data. If anything, the US economy appears to benefit from the presence of many small R&D intensive companies. They are present in many sectors of economic activity, which may be an indication of the penetration of new technology applications in other than traditionally high tech sectors. JEL Codes: L11, 030. Keywords: R&D Intensity, firm size, panel data • Ortega-Argilés, R., Potters, L. and Vivarelli, M. (2008), “R&D and labour productivity: Testing Sectoral Peculiarities with Micro Data”, IZA Discussion Paper 3338. • Presented at the IEEE International Engineering Management Conference 2008, Estoril, Portugal • Presented at the Knowledge for Growth: European Strategies in the Global Economy conference, Toulouse, France • Presented at the Unit of Econometrics and Applied Statistics, IPSC-JRC (Ispra, Italy) • Presented at the EARIE 2008 (European Association for Research in Industrial Economics) Conference 2008, Toulouse, France • Under review process in a peer-reviewed journal • Abstract: The aim of this study is to investigate the relationship between a firm's R&D activities and its productivity using a unique micro data panel dataset and looking at sectoral peculiarities which may emerge; more specifically, we used an unbalanced longitudinal database consisting of 532 top European R&D investors over the six-year period 2000-2005. Our main findings can be summarised along the following lines: knowledge stock has a significant positive impact on a firm's productivity, with an overall elasticity of about 0.125; this general result is largely consistent with previous literature in terms of the sign, the significance and the estimated magnitude of the relevant coefficient. More interestingly, the coefficient increases monotonically when we move from the low-tech to the medium-high and high-tech sectors, ranging from a minimum of 0.05/0.07 to a maximum of 0.16/0.18. This outcome, in contrast with recently-renewed acceptance of low-tech sectors as a preferred target of R&D investment, suggests that firms in high-tech sectors are still far ahead in terms of the impact on productivity of their R&D investments, at least as regards top European R&D investors. • JEL Codes: O33. Keywords: R&D, productivity, knowledge stock, panel data, perpetual inventory method • Potters, L. (2008), “Technological characteristics and the effects of internal and external R&D on innovation output” • Presented at 3rd ZEW Conference on the Economics of Innovation in Mannheim, Germany (12-14 June, 2008) • Presented at the Patenting and the Knowledge for Growth Conference in Toulouse, France (7-9 July, 2008)resented at 3rd ZEW Conference on the Economics of Innovation and Patenting (Manheim, Germany) • Contribution to PhD dissertation of L. Potters (Young Research Fellow at IPTS) Abstract: This research investigates the impact of internal and external innovation expenditures on innovation output by using Spanish CIS3 data on 8,418 firms (of which 3,199 innovators) and applying a Knowledge Production Function. Two main topics are dealt with. First, it is confirmed that different innovation activities lead to different types of innovation, but only when the specific technological opportunities that a firm experiences are taken into account. Second, firms make an allocation decision for spending on internal and external innovation activities. According to literature, these activities can be complementary in the way that external sources require internal knowledge for absorbing the benefits. • JEL Codes: O32, O33. Keywords: R&D, innovation, resource allocation, Knowledge Production Function, complementarity effects