Download

1 / 13
130 likes | 147 Vues
Explore the trends in the South African tobacco industry from 1981 to 2006, covering legal cigarette volumes, illicit trade, impact on farmers, ingredients, snus use, and research methodology. Discover the dynamics shaping the industry over the years.

E N D
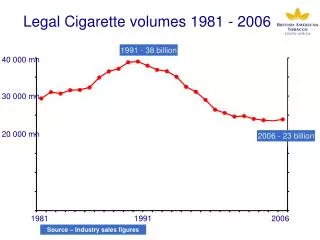
1991 - 38 billion Legal Cigarette volumes 1981 - 2006 40 000 mn 30 000 mn 20 000 mn 2006 - 23 billion 1981 1991 2006 Source – Industry sales figures
Fewer people are smoking Source – General Consumer Survey, 2001 - 2006
Total tobacco not declining since 2001,but illicit trade is growing 70.7% 72.8% 73.6% 68.3% 63.7% 63.5% Illicit Trade Pipe/RYO Legal Cigarette Source - Illicit Trade Research – Research International
Impact on farmers and farm workers 1990 – 1016 farmers 1990 – 60 810 farm workers 2006 – 200 farmers 2006 – 21 000 farm workers Source – Tobacco Institute of South Africa
1000’s of substances Burnt in a cigarette Combustion of Tobacco TAR max 12mg/cig Nicotine max 1.2mg/cig in smoke as per machine measure Nicotine (1%-4%) no TAR Particles + = 100’s of substances Gas / Vapour Tobacco Leaf Smoke Aerosol TAR: Total Aerosol Residue
1000’s of substances Snus-use and consequences Snus with tobacco in it No burning of Snus No tar + = TAR: Total Aerosol Residue
Non-tobacco ingredients for TOTAL BATSA portfolio 13 ingredients 33 ingredients 8 ingredients 1 ingredient 6 ingredients 4 ingredients 6 ingredients http://www.bat-ingredients.com or batsa.com
Background • This project is designed to track the incidence of illicit trade in tobacco products in SA • Monthly waves of interviews and pack retrievals with respondents around the country. • Because all outlet types are representatively covered in a three month period of fieldwork, the total sample is a good, representative sample of cigarette purchases.
Definition of illicit Legal Compliant SA Stock – packs Counterfeit – packs Non-compliant (duty not paid, no H/W, etc) – packs – tar for all above 12mg Definitely illicit Illicit Suspect Suspect Priced – packs (local manufactured) Suspect Priced – packs (SADC manufactured) Suspect Priced – packs (EU manufactured) Below R8.50
Methodology • Representative coverage (time/ day/ area/ store type) • One wave per year we have 2 interviewers per oultet • Interviewer 1: cigarette purchase incidence • Interviewer 2: exit interviews & product swap • Interview structure: • Masked as Quality Control • Demographic and pricing questions • Product swap (incentive: R20/pack) • Collected product analysed by BATSA internal experts • Quality control: • 100% questionnaire check, Spot checks on outlets • Back checks per interviewer: Average 30%
Methodology: Sample breakdown *margin of error = 1.3%
Internal verification • Due to the serious nature of the research certain key checks and balances undertaken • Methodology Audited by BAT International Auditors against Global Protocol • Currently being audited by BATSA internal audit against independent research standards – SAMRA (South African Market Research Association) • Results then cross referenced against other BAT research