Download
1 / 12
120 likes | 245 Vues
This document explores the dynamics of how changes in consumer income and prices influence the quantity demanded of normal and inferior goods. A rise in income results in an increase in the quantity demanded for normal goods, while it decreases for inferior goods, influenced by individual preferences. It also discusses the substitution effect, where consumers may substitute goods as their prices change, and the income effect, which affects purchasing power. Diagrams illustrate shifts in budget lines and demand curves, demonstrating these economic principles in action.

E N D
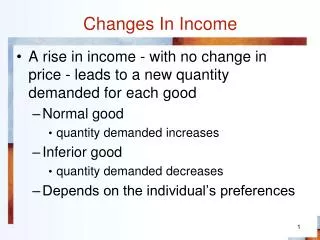
Changes In Income • A rise in income - with no change in price - leads to a new quantity demanded for each good • Normal good • quantity demanded increases • Inferior good • quantity demanded decreases • Depends on the individual’s preferences
Changes In Income • Initial Income= $150; • New Income = $300 per month • Pconcert=$30; Pmovie=$10 • Figure 5 Effects of an Increase in Income
30 Number of Movies per Month 27 A 15 B 12 H C 9 D 6 E 3 F 1 2 3 4 5 6 7 8 9 10 Number of Concerts per Month Changes In Income • Figure 5 Effects of an Increase in Income 2. If his preferences are as given in the table, he'll choose point H H'' 1. When Max's income rises to $300, his budget line shifts outward. 3.But different marginal utility numbers could lead him to H' or H'' H'
Changes In Price • Rotates the budget line rightward • The consumer will select the combination of movies and concerts • On his budget line • Makes him as well off as possible • Marginal utility per dollar spent on both goods is the same
Changes In Price • Income = $150 per month • Initial: Pconcert=$30; Pmovie=$10; • Change: Pconcert=$10; Pmovie=$10 • Figure 6 Deriving the Demand Curve
15 Number of Movies per Month 10 8 6 0 3 5 7 10 15 30 Price per Concert $30 10 5 3 7 10 Number of Concerts per Month Deriving the Demand Curve • Figure 6 Deriving the Demand Curve 1. When the price of concerts is $30, point D is best for Max. 2. If the price falls to $10, Max's budget line rotates rightward, and he chooses point J. K J D 3. And if the price drops to $5, he chooses point K. D 4. The demand curve shows the quantity Max chooses at each price. J K
The Substitution Effect • As the price of a good falls, the consumer substitutes that good in place of other goods whose prices have not changed. • Change in the relative price • Price decreases - increase quantity demanded • Price increases - decrease quantity demanded
The Income Effect • As the price decreases - increase purchasing power • Normal goods - increase quantity demanded • Inferior goods - decrease quantity demanded • Price increases - decrease purchasing power
Combining Substitution and Income Effect • Normal Goods • Substitution and income effects work together • Must always obey the law of demand • Inferior Goods • Substitution and income effects work against each other • The substitution effect dominates • Virtually always obey law of demand
Income and Substitution Effects • Figure 7 Income and Substitution Effects Price Decrease: Ultimate Effect (Almost Always) Substitution Effect P QD Þ QD QD if normal Purchasing Power QD if inferior Price Increase: Substitution Effect P QD Þ QD QD if normal Purchasing Power QD if inferior
Jerry George Elaine Price Price Price $4 $4 $4 3 3 3 2 2 2 1 1 1 0 4 12 0 6 12 0 10 20 Consumers in Markets • Figure 8 From Individual to Market Demand = + + C C' C'' Number of Bottles per Week
Price $4 3 2 1 3 10 27 44 Number of Bottles per Week Deriving the Market Demand Curve • Figure 8 From Individual to Market Demand A Market Demand Curve - obtained by adding up the total quantity demanded by all market participants at different prices B C D E