Object-Oriented Systems Analysis and Design Using UML
Object-Oriented Systems Analysis and Design Using UML. 18. Systems Analysis and Design, 7e Kendall & Kendall. © 2008 Pearson Prentice Hall. Learning Objectives. Understand what object-oriented systems analysis and design is and appreciate its usefulness

Object-Oriented Systems Analysis and Design Using UML
E N D
Presentation Transcript
Object-Oriented SystemsAnalysis and Design Using UML 18 Systems Analysis and Design, 7e Kendall & Kendall © 2008 Pearson Prentice Hall
Learning Objectives • Understand what object-oriented systems analysis and design is and appreciate its usefulness • Comprehend the concepts of unified modeling language (UML), the standard approach for modeling a system in the object-oriented world • Apply the steps used in UML to break down the system into a use case model and then a class model • Diagram systems with the UML toolset so they can be described and properly designed • Document and communicate the newly modeled object-oriented system to users and other analysts
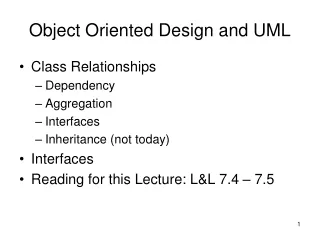
Object-Oriented Analysis and Design • Works well in situations where complicated systems are undergoing continuous maintenance, adaptation, and design • Objects, classes and reusable • The Unified Modeling Language (UML) is an industry standard for modeling object-oriented systems
Object-Oriented Analysis and Design (Continued) • Reusability • Recycling of program parts should reduce the costs of development in computer-based systems • Maintaining systems • Making a change in one object has a minimal impact on other objects
Major Topics • Object-oriented concepts • CRC Cards and object think • Unified Modeling Language • Use case and other UML diagrams • Packages • Using UML
Object-Oriented Concepts • Objects • Classes • Inheritance
Objects • Persons, places, or things that are relevant to the system being analyzed • May be customers, items, orders and so on • May be GUI displays or text areas on a display
Classes • Defines the set of shared attributes and behaviors found in each object in the class • Should have a name that differentiates it from all other classes • Instantiate is when an object is created from a class • An attributes describes some property that is possessed by all objects of the class • A method is an action that can be requested from any object of the class
Figure 18.1 An example of a UML class. A class is depicted as a rectangle consisting of the class name, attributes, and methods
Inheritance • When a derived class inherits all the attributes and behaviors of the base class • Reduces programming labor by using common objects easily • A feature only found in object-oriented systems
Figure 18.2 A class diagram showing inheritance. Car and truck are specific examples of vehicles and inherit the characteristics of the more general class vehicle
CRC Cards and Object Think • CRC • Class • Responsibilities • Collaborators • CRC cards are used to represent the responsibilities of classes and the interaction between the classes
Figure 18.3 Four CRC cards for course offerings show how analysts fill in the details for classes, responsibilities, and collaborators, as well as for object think statements and property names
Interacting during a CRC Session • Identify all the classes you can • Creating scenarios • Identify and refine responsibilities
The Unified Modeling Language (UML) Concepts and Diagrams • Things • Relationships • Diagrams
Things • Structural things are • Classes, interfaces, use cases, and other elements that provide a way to create models • They allow the user to describe relationships • Behavioral things • Describe how things work • Interactions and state machines • Group things • Used to define boundaries • Annotational things • Can add notes to the diagrams
Relationships • Structural relationships • Tie things together in structural diagrams • Behavioral relationship • Used in behavioral diagrams
Structural Relationships • Dependencies • Aggregations • Associations • Generalizations
Behavioral Relationships • Communicates • Includes • Extends • Generalizes
Diagrams • Structural diagrams • Used to describe the relation between classes • Behavior diagrams • Used to describe the interaction between people (actors) and a use case (how the actors use the system)
Structural Diagrams • Class diagrams • Object diagrams • Component diagrams • Deployment diagrams
Behavioral Diagrams • Use case diagrams • Sequence diagrams • Collaboration diagrams • Statechart diagrams • Activity diagrams
Figure 18.4 An overall view of UML and its components: Things, Relationships, and Diagrams
Commonly Used UML Diagrams • Use case diagram • Describing how the system is used • The starting point for UML modeling • Use case scenario • A verbal articulation of exceptions to the main behavior described by the primary use case • Activity diagram • Illustrates the overall flow of activities
Commonly Used UML Diagrams (Continued) • Sequence diagrams • Show the sequence of activities and class relationships • Class diagrams • Show classes and relationships • Statechart diagrams • Show the state transitions
Figure 18.5 An overview of UML diagrams showing how each diagram leads to the development of other UML diagrams
Use Case Modeling • Describes what the system does, without describing how the system does it • Based on the interactions and relationships of individual use cases • Use case describes • Actor • Event • Use case
Figure 18.7 A use case scenario is divided into three sections: identification and initiation, steps performed, and conditions, assumptions, and questions
Activity Diagrams • Show the sequence of activities in a process, including sequential and parallel activities, and decisions that are made • Symbols • Rectangle with rounded ends • Arrow • Diamond • Long, flat rectangle • Filled-in circle • Black circle surrounded by a white circle • Swimlanes
Figure 18.8 Specialized symbols are used to draw an activity diagram
Creating Activity Diagrams • Created by asking what happens first, what happens second, and so on • Must determine what activities are done in sequence or in parallel • The sequence of activities can be determined from physical data flow diagrams • Can be created by examining all the scenarios for a use case
Swimlanes • Useful to show how the data must be transmitted or converted • Help to divide up the tasks in a team • Makes the activity diagram one that people want to use to communicate with others
Figure 18.9 This activity diagram shows three swimlanes: Client Web Page, Web Server, and Mainframe
Sequence Diagrams • Illustrate a succession of interactions between classes or object instances over time • Often used to show the processing described in use case scenarios • Used to show the overall pattern of the activities or interactions in a use case
Figure 18.10 Specialized symbols used to draw a Sequence Diagram
Figure 18.11 A sequence diagram for student admission. Sequence diagrams emphasize the time ordering of messages
Communication Diagrams • Describes the interactions of two or more things in the system that perform a behavior that is more than any one of the things can do alone • Shows the same information as a sequence diagram, but may be more difficult to read • Emphasizes the organization of objects • Made up of objects, communication links, and the messages that can be passed along those links
Figure 18.12 A Communication Diagram for student admission. Communication diagrams show the same information that is depicted in a sequence diagram but emphasize the organization of objects rather than the time ordering
Class Diagrams • Show the static features of the system and do not represent any particular processing • Shows the nature of the relationships between classes • Shows data storage requirements as well as processing requirements
Class Diagrams (Continued) • Classes • Attributes • Private • Public • Protected • Methods • Standard • Custom
Figure 18.13 A class diagram for course offerings. The filled-in diamonds show aggregation and the empty diamond shows a whole-part relationship
Method Overloading • Including the same method (or operation) several times in a class • The same method may be defined more than once in a given class, as long as the parameters sent as part of the message are different
Types of Classes • Entity classes • Interface classes • Abstract classes • Control classes
Entity Classes • Represent real-world items • The entities represented on an entity-relationship diagram
Interface or Boundary Classes • Provide a means for users to work with the system • Human interfaces may be a display, window, Web form, dialogue box, touch-tone telephone, or other way for users to interact with the system • System interfaces involve sending data to or receiving data from other
Abstract Classes • Linked to concrete classes in a generalization/specialization relationship • Cannot be directly instantiated
Control Classes • Used to control the flow of activities • Many small control classes can be used to achieve classes that are reusable
Defining Messages and Methods • Each message may be defined using a notation similar to that described for the data dictionary • The methods may have logic defined using structured English, a decision table, or a decision tree
Figure 18.15 A Sequence Diagram for using two Web pages: one for student information, one for course information