Download
1 / 1
10 likes | 155 Vues
Attitudes Towards Science: Demographics, Education, or Knowledge? Christina K. Pikas, cpikas@umd.edu University of Maryland College of Information Studies. Introduction. Results. Discussion and Conclusions.

E N D
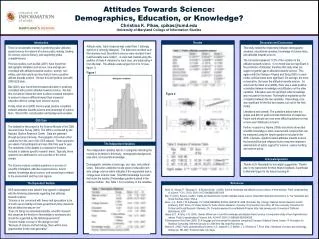
Attitudes Towards Science:Demographics, Education, or Knowledge? Christina K. Pikas, cpikas@umd.eduUniversity of Maryland College of Information Studies Introduction Results Discussion and Conclusions Attitude scale: Each response was coded from 1 (strongly agree) to 4 (strongly disagree). The data were recoded such that answers most favorable to science were recoded 4 and least favorable were coded 1. A scale was created using the addition of these 4 variables for each case, and subtracting 4 from the total. The attitude scale ranges from 0 to 12 (see figure 1). There is considerable interest in predicting public attitudes toward science for reasons of science policy making, funding for science, science literacy, and supporting global competitiveness. Previous studies, such as Bak (2001) have found that demographic variables such as sex, race and age are correlated with attitudes towards science: women, non-whites, and older adults are less likely to have a positive attitude towards science. We test this and political view with 2006 GSS data. Bak (2001) also found that increased education is positively correlated with positive attitudes towards science. We test this, but add an interaction term to allow increased education in science to have a different impact than increased education without college level science courses. Finally, Allum et al (2008) found a weak positive correlation between attitudes towards science and knowledge of science facts. We test this, net education and background variables. This study tested the relationship between demographic variables, educational variables, knowledge of science facts, and attitudes towards science. The full model explained 11.5% of the variation in the attitudes towards science. In no model was sex significant in the prediction of attitudes; therefore this study does not support a gender gap in attitudes towards science. This agrees with the findings of Hayes and Tariq (2000). In each model, political views were significant. On average, the more conservative, the lower the attitudes towards science. As was found by Allum et al (2008), there was a weak positive correlation between knowledge and attitudes, net the other variables. Education was not significant when knowledge was included in the model. That might be explained by the correlation between the two variables. Interestingly, race was significant for the first two models, but not for the final model. Limitations and caveats. The questions asked were too simple and did not yield a normal distribution of responses. Future work should use new, more difficult questions so that a more even distribution is found. Further, research by Wynne (1995) and others shows that scientific knowledge is more nuanced and complex than can be measured using the simple questions included in the GSS. Likewise, questions about attitudes towards science that omit political and religious factors may miss important determinants of public support for science, science funding, and science policy. Figure 1 Figure 2: GSS Data The dataset for this project is the Science Module of the 2006 General Social Survey (GSS). The GSS is conducted by the National Opinion Research Center. Data are gathered through personal interview. Demographic and certain other variables form the core of the GSS dataset. These questions are asked of all participants and vary little from year to year. The remainder of the dataset is composed of modules included to address specific research areas. Typically, these questions are addressed to only a portion of the entire sample. The Science module contains questions on sources of scientific information, attitudes toward science, trust in leaders, knowledge about science, and several topics related to the environment and the polar regions. The Independent Variables The independent variables fall into 3 categories reflecting the models to be tested in this study: demographic/background, education, and scientific knowledge. Demographic variables include age, sex, race, and political views. Education variables include years of education and also college science which indicates if the respondent took a college-level science class. Scientific knowledge is a scale that sums the results of knowledge questions asked in the science module. See Table 1 for a summary of the variables. Acknowledgements Thanks to Dr. Neustadtl for his helpful suggestions Thanks also to my classmates for their helpful feedback, in particular to Mehmet Ergun for his help in learning R. The Dependent Variable References GSS respondents were asked if they agreed or disagreed with the following statements regarding their attitudes towards science: “Science is too concerned with theory and speculation to be of much use in making concrete government policy decisions that will affect the way we live” “Even if it brings no immediate benefits, scientific research that advances the frontiers of knowledge is necessary and should be supported by the federal government” “Science makes our way of life change too fast” “Because of science and technology, there will be more opportunities for the next generation” Allum, N., Sturgis, P., Tabourazi, D., & Brunton-Smith, I. (2008). Science knowledge and attitudes across cultures: A meta-analysis. Public Understanding of Science, ''17(1), 35-54. DOI:10.1177/0963662506070159 Bak, H. (2001). Science in public: Trends and determinants of public attitudes toward science. Dissertation Abstracts International, A: The Humanities and Social Sciences, 62(4), 1603-A Davis, J. A., Smith, T.W, & Marsden, P.V. (2006) GENERAL SOCIAL SURVEYS, 2006: [Computer file]. Chicago: National Opinion Research Center [producer], 2007. Storrs, CT: Roper Center for Public Opinion Research, University of Connecticut / Ann Arbor, MI: Inter-university Consortium for Political and Social Research / Berkeley, CA: Computer-assisted Survey Methods Program (http://sda.berkeley.edu), University of California [distributors], 2007. Hayes, B. C., & Tariq, V. N. (2000). Gender differences in scientific knowledge and attitudes toward science: A comparative study of four Anglo-American nations. Public Understanding of Science, 9(4), 433-447. DOI:10.1088/0963-6625/9/4/306 R Development Core Team (2005). R: A language and environment for statistical computing. [Computer Software] Vienna, Austria: R Foundation for Statistical Computing. Retrieved January 20, 2008 from http://www.R-project.org . Wynne, B. (1995). Public understanding of science. In S. Jasanoff, G. E. Markle, J. C. Petersen & T. Pinch (Eds.), Handbook of science and technology studies (pp. 361-388). Thousand Oaks, CA: Sage.