Download

1 / 26
260 likes | 380 Vues
NESTOA September 16, 2011 Scott Pattison Executive Director National Association of State Budget Officers. 444 North Capitol Street, NW, Suite 642 • Washington, DC 20001 • (202) 624-5382 • www.nasbo.org. Current Fiscal Situation. State Fiscal Outlook. Revenue Improvement Spring

E N D
NESTOA September 16, 2011 Scott Pattison Executive Director National Association of State Budget Officers 444 North Capitol Street, NW, Suite 642 • Washington, DC 20001 • (202) 624-5382 • www.nasbo.org
State Fiscal Outlook • Revenue Improvement Spring • Spending Pressure • Health care reform • Limited federal funds • Significant restructuring
Medicaid In Millions Fiscal 2011 data is based on enacted budgets and fiscal 2012 data is based on governors’ proposed budgets Source: NASBO Spring 2011 Fiscal Survey of States
National Economic Indicators • 2nd Quarter GDP grows 1.0% • 8th straight quarter of some growth; grew 0.4% in 1st Q. • Growth forecasts revised downward • CBO revises GDP forecast to 1.5% in 2011 and 2.5% in 2012 • NABE revises GDP forecast to 1.7% in 2011 and 2.3% in 2012 • Other economic figures: • Unemployment rate unchanged at 9.1% in August • CBO projects it will remain near 9% through 2012 • 12 Federal Reserve Districts report modest or slow growth • Manufacturing grows for 25th straight month in August, although growth slows • Home Sales fell in July; still higher than last year
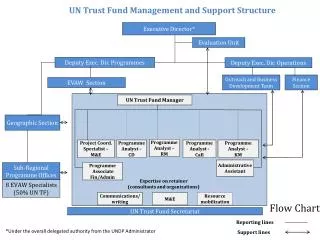
State and Local Employment Continues to Decline • State and local employment has declined 620,000 from the start of the recession through July • State employment declined 145,000 from Aug. 2008-July 2011 • Local employment declined 475,000 from Sept. 2008-July 2011 • State governments eliminated 23,000 positions in July alone • States have also taken other personnel actions such as furloughs, early retirement, salary reduction, cuts to state employee benefits, etc. Source: Bureau of Labor Statistics
State Debt Level Remains Comparatively Low Debt-to-GDP: U.S. States Compared to Advanced G20 Nations – Moody’s Investor Services & International Monetary Fund %
Current Fiscal Situation: Indicators
BudgetImprovement * Average *34-year historical average rate of growth is 5.7percent *Fiscal ‘12 numbers are recommended Source: NASBO Spring 2011 Fiscal Survey of States
Mid-Year Budget Cuts Decline Budget Cuts Made After the Budget Passed ($ millions) *FY 2011 mid-year budget cuts are ongoing Source: NASBO Spring 2011 Fiscal Survey
FY 2012 Proposed Spending Still Less than FY 2008 ($ in billions) * FY 2007, 2008, 2009 and 2010 are actual. FY 2011 is estimated and FY 2012 is proposed..
6 Quarters of Revenue Growth Following 5 Quarters of Declines Source: Fiscal Studies Program, Rockefeller Institute of Government; U.S. Census Bureau
Revenue Remains Below Pre-Recession Levels ($ in billions) * FY 2007, 2008, 2009 and 2010 are actual. FY 2011 is estimated and FY 2012 is proposed.
Balance Levels are Below Historical Average for Most States Balances as a Percentage of Expenditures (percentages) * FY 2006, 2007, 2008, 2009, 2010 are actual, FY 2011 is estimated and FY 2012 is proposed.
Spending by Funding Source(Percentage) Source: NASBO 2009 State Expenditure Report
Total State Expenditures Source: NASBO 2009 State Expenditure Report 19
General Fund: Medicaid & Education Over 63% Source: NASBO 2009 State Expenditure Report
Percentage Change in Medicaid Spending and Enrollment % Adopted Source: Kaiser Commission on Medicaid and the Uninsured
What Can Be Done? • Financial Management • Ask performance questions • Ask for outcome data • Use performance information to justify changes to programs
Major Challenges to State Budgets • Spending Demands and Some Revenue Growth • Dependent on Economic Growth • Health Care Cost Pressures • Wind Down of Recovery Funds (Planned For) • Dealing with Long Term Liabilities • Court Cases/Federal Government Mandates
Tough Decisions to Make… Source: New York Times, 6/12/11
www.nasbo.org Scott Pattison (202) 624-8804 spattison@nasbo.org