Assessment of South Carolina GAP Models for Herpetofauna & Mammal Species
Evaluate GAP analysis vertebrate models in predicting reptile, amphibian, and mammal species occurrence on a natural site. Assess the spatial correspondence of models and capture data to enhance accuracy and conservation efforts.

Assessment of South Carolina GAP Models for Herpetofauna & Mammal Species
E N D
Presentation Transcript
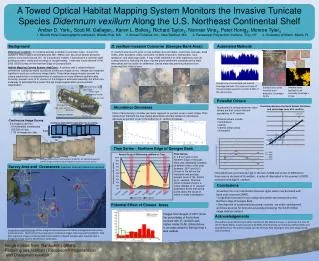
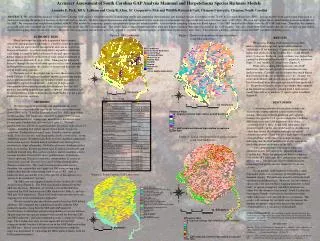
Accuracy Assessment of South Carolina GAP Analysis Mammal and Herpetofauna Species Richness Models N W E S Kilometers 6 0 6 1 2 D i f f e r e n c e V a l u e - 8 C a p t u r e r i c h n e s s h i g h r e l a t i v e t o G A P p r e d i c t e d - 2 2 3 4 5 1 0 1 1 G A P p r e d i c t e d r i c h n e s s h i g h r e l a t i v e t o c a p t u r e d N o D a t a Amanda E. Peck, Jill A. LaBram and Craig R. Allen, SC Cooperative Fish and Wildlife Research Unit; Clemson University, Clemson, South Carolina ABSTRACT: We assessed the accuracy of the South Carolina GAP analysis vertebrate models in predicting reptile and amphibian (herpetofauna) and mammal species occurrence on the 78,000 ha Savannah River Site (SRS). Species models from capture data were used as a method of assessing the predictive accuracy of the GAP analysis models. We have trapped herpetofauna and small mammals at five replicates of seven landcover types in the fall season for three years (1999-2001). We used our capture data to build habitat-association models for the SRS. We compared our sample-based models with SC GAP models by comparing spatial correspondence in species richness models. Our vertebrate sampling scheme was based upon a 7-class SRS landcover that differs from the SC GAP landcover. Therefore, we created a crosswalk table that converted the GAP coverage classifications into SRS classifications. Our results indicate that commission errors were much more common than omission errors in the GAP models. This may result from GAP models that are too general, or may reflect insufficient trapping effort on our study areas. However, our comparisons and analyses were only applied to common, abundant species, so the former explanation is more likely. This indicates a need to continue to refine the GAP vertebrate-modeling process. Figure 1. SRS Landcovers Figure 3. Spatial correspondence of species richness using SRS landcovers INTRODUCTION Many landscapes are currently fragmented due to human settlement and degradation, and there is a need to assess how effective (i.e., if there are gaps) current management areas are in conserving biological diversity. As conservation efforts expand to a landscape scale, there is a need to make better use of site and species-specific habitat relation models to predict broad-scale spatial distribution of animal species (Edwards Jr. et al. 1996). Managing for biological diversity through the use of indicator species such as small mammals and herpetofauna increases the chance of success and decreases the cost of monitoring programs. The main goal of this project was to assess the accuracy of the South Carolina GAP analysis vertebrate models in predicting reptile and amphibian (herpetofauna) and mammal species occurrence as compared to capture-based models. A degree of high spatial correspondence between the models would indicate that the GAP model is reasonable in predicting species captured. Alternately, a lack of correspondence would indicate that the GAP model was not a good predictor of species captured. RESULTS When cross-walking GAP landcovers into SRS landcovers,swamp-edge had spatial correspondence (difference = 0) for both taxa. Captured species richness was higher than predicted in the Carolina bay (-1) and planted pine (-2) classes. Predicted species richness was higher than captured in Bottomland hardwood (3), mixed (6), hardwood slope (7), and sandhill (11) landcovers (Figure 3). When cross-walking SRS landcovers into GAP landcovers, there was no spatial correspondence for any landcover type. Captured species richness was much higher than predicted in the wet evergreen class (-8). Swamp, wet scrub/shrub thicket, and closed canopy evergreen mixed forest/woodland were also more species-rich than predicted (-2). The predicted species richness was higher than captured in the remaining landcovers, ranging from 2 more species (sandy bare soil) to as much as 11 species (pine woodland) (Figure 4). Table 1. Crosswalk METHODS We have trapped herpetofauna and small mammals at five replicates of seven landcover types in the fall season for three years (1999-2001) at the 78,000 ha Savannah River Site (SRS), near Aiken, South Carolina. The landcovers, classified by Imm (1997) include bottomland hardwood, swamp edge, mixed forest, hardwood slope, planted pine, Carolina bay, and sandhill (Figure 1). We built presence/absence habitat-association models for species with at least 19 captures, including four reptile species (fence lizard, Sceloporus undulatus; Southeastern crowned snake, Tantilla coronata; ground skink, Scincella lateralis; and Green anole, Anolis carolinensis) , seven amphibian species (Southern toad, Bufo terrestris; marbled salamander, Ambystoma opacum; Eastern narrow-mouthed toad, Gastrophryne carolinensis; slimy salamander, Plethodon glutinosis; Southern cricket frog, Acris gryllus; Eastern spadefoot toad, Scaphiopus holbrooki; and Southern leopard frog, Rana sphenocephala), and six mammal species (eastern woodrat, Neotoma floridana; golden mouse, Ochrotomys nuttali; opossum, Didelphis virginiana; cotton mouse, Peromyscus gossypinus; raccoon, Procyon lotor; and Carolina shorttail shrew, Blarina carolinensis). This study focused on terrestrial species; therefore, our capture data only apply to a 200 meter swamp edge buffer rather than the entire swamp land cover at SRS. Also, a landcover must account for at least five percent of the captures for a species to be considered “present.” The SRS area was clipped from the South Carolina (SC) GAP Analysis map (Figure 2). The GAP classification differed from the SRS classification. Therefore, we created a crosswalk table that converted the GAP landcovers into SRS landcovers (Table 1), and also SRS into GAP landcovers. Those GAP landcovers not relevant to our trapping sites were considered not applicable. We also created a presence/absence matrix based on GAP habitat affinities. We compared our sample-based models with the GAP predictive models, using both the SRS and GAP landcover classifications, to determine spatial correspondence of species richness. Spatial maps for taxa species richness were created for both the GAP and SRS landcovers, and were combined to make a composite richness map. The Carolina bay class was not applicable for the GAP composite model, because it did not occur in the GAP landcover within the SRS area. Spatial correspondence between the two composite maps was determined by subtracting the SRS capture richness from the GAP predicted richness. DISCUSSION Converting between classification systems can increase the commission and omission errors of the models. The range between predicted and captured richness was greater (by 6 species) when cross-walking SRS landcovers into GAP landcovers than when converting GAP to SRS. Some GAP landcovers were grouped together in the crosswalk based on classification rather than spatial distribution, leading to increased commission errors. There was not a high degree of spatial correspondence within these two composite maps, indicating that the GAP models may not be accurate in predicting species occurrence on the SRS. The captured richness was higher relative to predicted in only two landcovers: planted pine and Carolina bay. While the planted pine habitat comprises 69% of the SRS landscape, the Carolina bays only make up <1% area. This indicates that we should focus on protecting biologically diverse landcovers of all size classes. In our models, GAP tended to over-predict rather than under-predict the occurrence of herpetofauna and mammal species. This indicates a need to refine the GAP vertebrate modeling process. However, failure to detect a species on a site may be due to trapping difficulty, natural rarity, or spatial or temporal variability in habitat use rather than the absence of the animal. South Carolina has been under drought conditions for the duration of this study, which may have affected species occurrence. This project will continue for two more years to increase the number of captures, which may increase the spatial correspondence (i.e., accuracy) of the models. Figure 4. Spatial correspondence of species richness using GAP landcovers Figure 2. South Carolina GAP Landcovers ACKNOWLEDGEMENTS: We would like to thank Clemson University, the South Carolina Co-Operative Unit and the USDA Forest Service-Savannah River for funding and supplies. We would also like to thank the help of fellow graduate students and technicians. Literature Cited: Edwards, T.C. Jr. E. T. Deshler, D. Foster, and G.G. Moisen. 1996. Adequacy of wildlife habitat relation models for estimating spatial distributions of terrestrial vertebrates. Conservation Biology. 10:263-270. Imm, D. 1997. ArcView classification of the land covers of the Savannah River Site. USDA Forest Service, Savannah River Institute, New Ellenton, S.C.