Download
1 / 1
10 likes | 148 Vues
PLANT_HT. Wet and Dry Masses of Plants (g) . Chi-Square. 4.790. Camm Tabb . Tabler Farm. Control. df. 2. Asymp. Sig. .091. Total Wet. 5.78. 24.09. 15.95. Total Dry. 1.25. 4.83. 5.27. Difference. 4.53. 19.26. 10.68.

E N D
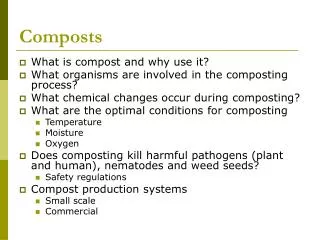
PLANT_HT Wet and Dry Masses of Plants (g) Chi-Square 4.790 Camm Tabb Tabler Farm Control df 2 Asymp. Sig. .091 Total Wet 5.78 24.09 15.95 Total Dry 1.25 4.83 5.27 Difference 4.53 19.26 10.68 An Investigation Into The Properties And Performance of Camm Tabbs and Tabler Farm Composts Thank you Dr. Drohan, Dr. Vila, Dr. Best, and Camm Tabb Introduction Maturity Tests The test was carried out using a Solvita test kit produced by Woods EndResearch to determine the carbon dioxide (CO2) and ammonia (NH3) present in each sample. Samples were prepared by mixing the compost with water until the samples were significantly moist, but did not release water when squeezed.After preparation, the samples were placed into jars provided with the test kit. Two chemically coated paddles were placed in each jar, one to determine CO2 and the other to determine NH3. After four hours, the color on the paddle was compared to a color chart provided in the test kit, and the amounts of tested compounds were recorded. Maturity was also tested using the Dewar self-heating test, as outlined in Brinton et.al “A Standardized Dewar Test For Evaluation of Compost Self-Heating.” The compost was prepared in the same way as for the Solvitatest, and placed in a 2-liter, steel-encased Dewar vessel with a 100mm inner diameter. The inside and outside temperatures were then recorded with digital thermometer attached to wand inserted into the compost and vessel. The temperature of the compost and the outside air was recorded for several days to determine the highest temperature achieved. Economic and environmental concerns are encouraging a reevaluation of the way farmers and agriculturalists produce. (Humpert, 2000). Because of these concerns, compost research is now being viewed as an essential component in the process of moving away from a chemical based agricultural system and toward a more whole-systems approach (Goldstein, 1999). Compost can be an effective tool in improving soil quality, reducing the need for fungicide and pesticide applications, reducing the number of soil-borne plant diseases, controlling erosion, reducing water consumption, and acting as a slow-release fertilizer (Humpert, 2000; Rynk, 2001). Unfortunately, while the United States Department of Agriculture does have set standards of what materials and chemicals can and cannot be added to compost, as well as policies concerning temperature, turning, etc., there are no standards of what must be present when a compost mixture is completed and sold to a consumer (Brodie, Oshens, 2001). This lack of standardization can lead to varying nutrient amounts, organic matter concentrations, and moisture content levels, which, if not in proper balance, can lead to inefficient composts and affect the uptake of nutrients (Jurgens, 2001). Although composts can differ depending on whereand howthey are made, and what they are made with, their importance can not be brushed aside in an area like Jefferson County still dominated by agriculture. For these reasons, this study set out to evaluate the performance, chemical, and physical properties of two locally produced composts for use in crop production. Both composts were made on local farms, however the methods employed to create them differed greatly. The Camm Tabb compost was produced on a large scale, with piles over 6 feet high and wide, and approximately 36 feet long, while the other was made on a small farm currently owned by Shepherd College using methods similar to what a homeowner would use. It is hoped that by conducting this research, insights into the effectiveness of methods of production, as well as preferred chemical makeup will be revealed, and allow both the environment and economy to prosper. Statistical Analysis A Kruskil-Wallis test indicated that there was a statistical difference between plant lengths at the α=0.100 level This difference between composts is supported by the results of the dry mass as well. pH 10g of each compost and 10g potting soil mix were collected, and each 10g sample divided between 5, 50ml beakers. 20ml of calcium chloride (CaCl2) was added to each beaker, and the beakers were stirred periodically for 30 minutes. The pH was then measured using a Fisher Scientific Acumet pH 915 meter which measures the amount of difference between the [H+] in the soil and the solution in an electrode. Mineral Analysis shows adequate availability of nutrients Camm Tabb’s N: 60 lbs./acre P: 100 lbs./acre K: 700 lbs./acre Tabler Farm N: 150 lbs./acre P: 150 lbs./acre K: 800 lbs./acre Mineral Analysis Composts were analyzed to determine mineral content using a LaMotte Company STH-4 Combination Soil Testing Outfit and the procedures outlined therein. Methods pH Growth Study Two five gallon buckets of compost were collected 15 pots were used for the study: 5 for the Camm Tabb compost, 5 for Tabler Farm compost, and 5 for a control of potting soil created by the Biology Department. The unblended composts were added to the pots, and approximately 300 (1.59g of) clover seeds were added to each pot, which were watered daily. The plants were removed from the pots, and the lengths of plants, from the tip of the root to just below the leaves, was measured. The dry mass of the plant material was also found. Results Plant Lengths Discussion and Conclusions The results of the statistical analysis, which indicate a difference between the plant lengths is supported by the results of the dry mass study. However, if one is to look at the properties of the composts, they will surely see that both composts are capable of encouraging and sustaining growth. It is my belief that the differences were caused by greenhouse conditions and lack of watering over weekends. It is my recommendation that this, or a similar study be repeated, perhaps outside in more realistic conditions. Regardless of the results obtained in the growth study, this project has shown that mature, productive, well balanced composts can be produced, independent of operation size.