Cluster Analysis of Aerosol Data: Worst vs. Best Days Patterns Comparison (1997-2001)
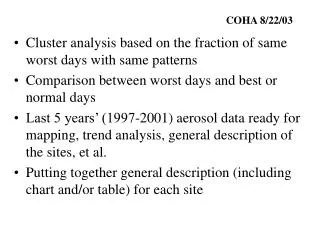
This study presents a cluster analysis based on the fraction of same worst days exhibiting similar patterns in aerosol data collected from 1997 to 2001. It compares these worst days against the best or normal days, focusing on eight identified patterns: S, N, OC, EC, Soil, CM, Pollution Species, and combined Soil and CM. Additionally, a comprehensive general description will be compiled for each site, which includes mapping, trend analysis, and the presentation of data in charts or tables for enhanced understanding and visualization.

Cluster Analysis of Aerosol Data: Worst vs. Best Days Patterns Comparison (1997-2001)
E N D
Presentation Transcript
COHA 8/22/03 • Cluster analysis based on the fraction of same worst days with same patterns • Comparison between worst days and best or normal days • Last 5 years’ (1997-2001) aerosol data ready for mapping, trend analysis, general description of the sites, et al. • Putting together general description (including chart and/or table) for each site
Cluster Analysis Based on the Fraction of Same Worst Days with Same Patterns* • * 8 Patterns: • S • N • OC • EC • Soil • CM • Pollution Species • Soil and CM