Understanding Opportunity Costs and Economic Incentives in Decision Making
Economists emphasize the importance of incentives, suggesting people respond to costs and benefits rationally. When faced with an extra hour of free time, choices must be made, reflecting opportunity costs—the value of the best alternative that is sacrificed. Every decision involves weighing marginal benefits against marginal costs. Understanding these principles can enhance business decision-making and personal choices, highlighting how our choices are influenced by the pursuit of maximization and efficiency in resource use.

Understanding Opportunity Costs and Economic Incentives in Decision Making
E N D
Presentation Transcript
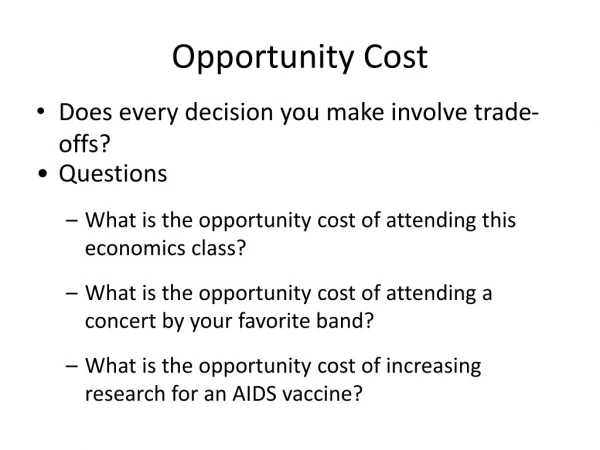
Incentives • Economists always think about incentives. They believe that people respond to incentives - that they weigh the costs and benefits rationally.
Imagine that you have an extra hour of free time this evening. Make a list of 5 to 10 things that you could do with that time.
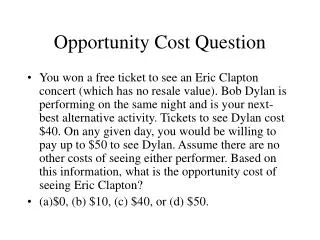
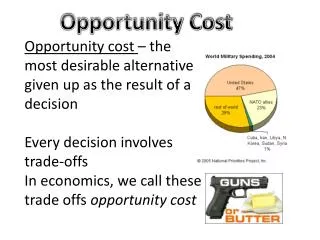
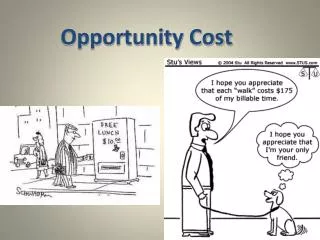
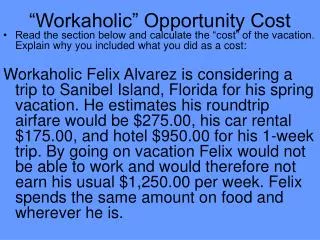
Opportunity Costs • What would you give up for something you want? • Trade off- the sacrifice of one thing in order to have another • Opportunity cost- the cost of the trade off or the value of the next best alternative that is given up • Business must make decisions when they decide what to do
Four Powers of Economic Thinking 1. Resources cost more than you think. Accounting costs--$ cost Opportunity cost-- The next highest-valued alternative. 2. All decisions are rational
Is this person’s decision rational? http://www.humoroftheday.com/gallery/images/Pierced1.jpg
3. All Decisions are Made at the Margin. Margin—the weighing of additional costs and additional benefits of a specific change in the current situation. http://www.new2usa.com/nova/english/00000226/penny.jpg
http://seattlepi.nwsource.com/dayart/20010824/226Ground24Q.jpghttp://seattlepi.nwsource.com/dayart/20010824/226Ground24Q.jpg
Who in here would NOT pick this $100 bill up if you saw it lying on the ground? Why would you pick it up? MB are at least = MC
Options 1st hour of extra study time 2nd hour of extra study time 3rd hour of extra study time Benefit Grade of C on test Grade of B on test Grade of B+ on test Opportunity Cost 1 hour of sleep 2 hours ofsleep 3 hours of sleep Thinking at the Margin • When you decide how much more or less to do, you are thinking at the margin.
4. People are maximizers We all want more than less. We want everything!
Edmund was a wise old man. And he was asthmatic. Thus, he has a tendency to wheeze. He decided he was breathing too much dirty air, and that he should put a new air cleaning system into his house. He talked to doctors, engineers, air system specialists, and sought opinions of anyone with an interest. He learned that the cleaner the air the more expensive the equipment he must install. And he did some heavy thinking about what it would mean to him to wheeze less. He learned the degree of comfort he would experience at different levels of clean air. He decided to place values on different amounts of clean air according to these comfort levels. The cost and benefit data are summarized in the following table:
Percentage of Total Total Clean AirBenefitsMBCostsMC 0% 0 0 10% 50 45 20% 130 50 30% 205 58 40% 269 68 50% 319 81 60% 351 96 70% 371 116 80% 386 150 90% 398 200 100% 406 280 0 0 50 45 5 80 75 8 64 10 50 13 32 15 20 20 15 34 12 50 80 8
Percentage of Total Total Clean AirBenefitsMBCostsMC 0% 0 0 10% 50 45 20% 130 50 30% 205 58 40% 269 68 50% 319 81 60% 351 96 70% 371 116 80% 386 150 90% 398 200 100% 406 280 0 0 50 45 5 80 75 8 64 10 50 13 32 15 20 20 15 34 12 50 80 8