
Analyzing Data Representation: Dana's Weekend Activities
This weekend, Dana logged her activities over 20 hours, allocating 7 hours to homework, 4 hours to chores, and 9 hours to spending time with friends. She visualized her data using a triangle. In this analysis, we will explore whether the triangle distorts the data and discuss if this method of representation works to Dana's advantage or disadvantage. Additionally, we will accurately present her activities through an appropriate graph. Finally, we’ll unscramble key terms that relate to data interpretation and graphical representation.

Analyzing Data Representation: Dana's Weekend Activities
E N D
Presentation Transcript
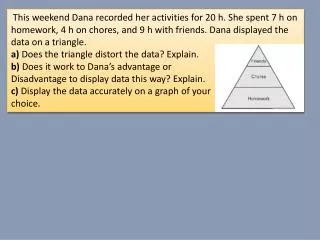
This weekend Dana recorded her activities for 20 h. She spent 7 h on homework, 4 h on chores, and 9 h with friends. Dana displayed the data on a triangle. a) Does the triangle distort the data? Explain. b) Does it work to Dana’s advantage or Disadvantage to display data this way? Explain. c) Display the data accurately on a graph of your choice.
Unscramble the letters of each term. The terms are one to three words long. Use the clues to help you solve the puzzles.
DETNR General direction in which a line graph is going
SDITOTR Change the appearance or twist the meaning of something in a way that is misleading