Understanding Risk Analysis in Statistics
Learn how to quantify risk in statistics by estimating central tendency, dispersion, and distribution shape. Explore sampling distributions, sample means, unbiased estimators, and confidence intervals for population parameters.

Understanding Risk Analysis in Statistics
E N D
Presentation Transcript
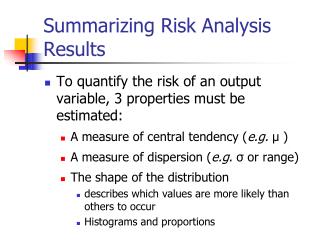
Summarizing Risk Analysis Results • To quantify the risk of an output variable, 3 properties must be estimated: • A measure of central tendency (e.g. µ ) • A measure of dispersion (e.g. σ or range) • The shape of the distribution • describes which values are more likely than others to occur • Histograms and proportions
Estimation _ • Sample Statistics are used to estimate Population Parameters • X = 50 is used to estimate Population Mean, • Problem: Different samplesprovidedifferent estimates of the Population Parameter • A sampling distribution describes the likelihood of different sample estimates that can be obtained from a population
Developing Sampling Distributions • Assume there is a population … • Population size N=4 • Random variable, X,is age of individuals • Values of X: 18, 20,22, 24 measured inyears C B D A
Developing Sampling Distributions (continued) Summary Measures for the Population Distribution P(X) .3 .2 .1 0 X A B C D (18) (20) (22) (24) Uniform Distribution
Developing Sampling Distributions All Possible Samples of Size n=2 (continued) 16 Sample Means 16 Samples Taken with Replacement
Developing Sampling Distributions Sampling Distribution of All Sample Means (continued) Sample Means Distribution 16 Sample Means P(X) .3 .2 .1 _ 0 X 18 19 20 21 22 23 24
Comparing the Population with its Sampling Distribution Population N = 4 Sample Means Distribution n = 2 P(X) P(X) .3 .3 .2 .2 .1 .1 _ 0 0 X AB C D (18)(20)(22)(24) 18 19 20 21 22 23 24 X
Properties of Summary Measures • i.e. is unbiased • Standard error (standard deviation) of the sampling distribution is less than the standard error of other unbiased estimators • For sampling with replacement: • As n increases, decreases
Unbiasedness P(X) Unbiased Biased
Effect of Large Sample Larger sample size P(X) Smaller sample size
Sample Size • Determining adequate sample size n: Large samples give better estimates. Large samples are more costly. • How much dispersion is therein the sample mean? • Standard Error = Assuming sampling with replacement or sampling without replacement from a large population
Central Limit Theorem the sampling distribution becomes almost normal regardless of shape of population As sample size gets large enough…
Confidence Interval for µ • One can be 95% confident that the true mean of an output variable falls somewhere between the following limits:
Population Proportions • Proportion of population having a characteristic • Sample proportion provides an estimate
Sampling Distribution of Sample Proportion • Mean: • Standard error: Sampling Distribution P(ps) .3 .2 .1 0 ps 0 . 2 .4 .6 8 1 p = population proportion
Confidence Interval for p • One can be 95% confident that the true proportion for an output variable that has a certain characteristic falls somewhere between the following limits:
Other Descriptions of Shape • Measures of symmetry • Skewness • Weighted average cube of distance from mean divided by the cube of the standard deviation • Symmetric distributions have 0 skew • Positively skewed: • tail to right side is longer than that to the left • Outcomes are biased towards larger values • Mean > median > mode