International Injury Indicators Comparison Study
Learn about the ICE criteria for injury indicators, coding rules, fatal injury data, and global injury mortality database analysis. Explore international drowning and exposure rates to understand variations in injury statistics. Access data from the Global Injury Mortality Database for country-level cause of death information.

International Injury Indicators Comparison Study
E N D
Presentation Transcript
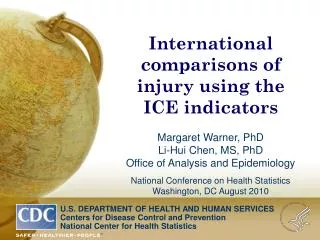
U.S. DEPARTMENT OF HEALTH AND HUMAN SERVICES Centers for Disease Control and Prevention National Center for Health Statistics International comparisons of injury using the ICE indicators Margaret Warner, PhD Li-Hui Chen, MS, PhD Office of Analysis and Epidemiology National Conference on Health Statistics Washington, DC August 2010
What we’ll talk about…. • International Collaborative Effort on Injury Statistics (ICE) criteria for indicators • Barriers to comparability • Coding rules • Unspecified codes • Global Injury Mortality Database • Fatal injury indicators • All injury • Motor vehicle traffic • Suicide • Homicide • Discussion
The ICE on Injury Statistics criteria for indicators Desirable qualities of injury indicators: • Case Definition. The indicator should reflect the occurrence of injury satisfying some case definition of anatomical or physiological damage. • Serious Injury. The indicator should be based on events that are associated with significantly increased risk of impairment, functional limitation, disability or death, decreased quality of life, or increased cost (i.e. serious injury). • Case Ascertainment. The probability of a case being ascertained should be independent of social, economic and demographic factors, as well as service supply and access factors.
The ICE on Injury Statistics criteria for indicators Desirable qualities of injury indicators (con’t) • Representativeness. The indicator should be derived from data that are inclusive or representative of the target population that the indicator aims to reflect. • Data Availability. It should be possible to use existing data systems, or it should be practical to develop new systems, to provide data for computing the indicator. • Specification.The indicator should be fully specified to allow calculation to be consistent at any place and at any time. Cryer C, Langley J. Developing indicators of injury incidence that can be used to monitor global, regional and local trends, 2008.
Barriers to international comparability • Coding rules Example: Manner of death • Data quality Example: Unspecified codes • ICE developed fixes Categorization of ICD codes into meaningful groups: External cause of injury matrices, Injury Mortality Diagnosis Matrix, and Barell Matrix for body region and nature
Example: International comparison of drowning death rates Unintentional drowning Country Death rate per 100,000 Australia 9.9 United Kingdom 3.4 United States 11.1 Why is the UK rate so low? Source: Bhalla, K., Harrison, J., Fingerhut, L., Shahraz, S., Abraham, J., Hsiu-Yeh, P., on behalf of the GBD Injury Expert Group, The Global Injury Mortality Database, Version 2.0, Released on October 21 2009, Available from www.globalburdenofinjuries.org
Drowning rates per million population for selected countries, 2004 Age adjusted rate per 100,000 Source: Bhalla, K., Harrison, J., Fingerhut, L., Shahraz, S., Abraham, J., Hsiu-Yeh, P., on behalf of the GBD Injury Expert Group, The Global Injury Mortality Database, Version 2.0, Released on October 21 2009, Available from www.globalburdenofinjuries.org
External cause of injury mortality matrix intent mechanism ICD External cause codes
Exposure to Unspecified Factor* Death rates, Selected countries, 2005 * ICD-10 X59 Exposure to Unspecified factor Source: Bhalla, K., Harrison, J., Fingerhut, L., Shahraz, S., Abraham, J., Hsiu-Yeh, P., on behalf of the GBD Injury Expert Group, The Global Injury Mortality Database, Version 2.0, Released on October 21 2009, Available from www.globalburdenofinjuries.org
Data Source Global Injury Mortality Database Data included: • Country level cause of death (injury) tabulations disaggregated by age-sex external cause categories (based on Global Burden of Diseases (GBD) & ICE definitions) Sources of data: • National civil registration systems • If possible, from the WHO Mortality Database • Other data submitted by the GBD Injury Expert Group* • http://sites.google.com/site/gbdinjuryexpertgroup
Data SourceGlobal Injury Mortality Database Processing of data: • Reclassified external causes to GBD and ICE definitions • Quality checked by accessing the proportion of deaths coded to partially specified causes • Redistributed cases with unspecified causes Data access: • GBD Injury Expert Group Website at http://sites.google.com/site/gbdinjuryexpertgroup • Use the Mortality Data : ICE Matrix Definitions
Injury death ratesSelected countries, 2005 Age adjusted rate per 100,000 South America Pacific Rim Europe Source: Bhalla, K., Harrison, J., Fingerhut, L., Shahraz, S., Abraham, J., Hsiu-Yeh, P., on behalf of the GBD Injury Expert Group, The Global Injury Mortality Database, Version 2.0, Released on October 21 2009, Available from www.globalburdenofinjuries.org
Injury death rates Selected countries and years Age adjusted rate per 100,000 Source: Bhalla, K., Harrison, J., Fingerhut, L., Shahraz, S., Abraham, J., Hsiu-Yeh, P., on behalf of the GBD Injury Expert Group, The Global Injury Mortality Database, Version 2.0, Released on October 21 2009, Available from www.globalburdenofinjuries.org
Motor vehicle traffic death ratesSelected countries, 2005 Age adjusted rate per 100,000 South America Pacific Rim Europe Source: Bhalla, K., Harrison, J., Fingerhut, L., Shahraz, S., Abraham, J., Hsiu-Yeh, P., on behalf of the GBD Injury Expert Group, The Global Injury Mortality Database, Version 2.0, Released on October 21 2009, Available from www.globalburdenofinjuries.org
Suicide ratesSelected countries, 2005 Age adjusted rate per 100,000 South America Pacific Rim Europe Source: Bhalla, K., Harrison, J., Fingerhut, L., Shahraz, S., Abraham, J., Hsiu-Yeh, P., on behalf of the GBD Injury Expert Group, The Global Injury Mortality Database, Version 2.0, Released on October 21 2009, Available from www.globalburdenofinjuries.org
Homicide rates Selected countries, 2005 Age adjusted rate per 100,000 South America Pacific Rim Europe Source: Bhalla, K., Harrison, J., Fingerhut, L., Shahraz, S., Abraham, J., Hsiu-Yeh, P., on behalf of the GBD Injury Expert Group, The Global Injury Mortality Database, Version 2.0, Released on October 21 2009, Available from www.globalburdenofinjuries.org
ICE mortality indicators • Progress on mortality indicators • Defined criteria • Identified potential indicators • Compared trends for selected countries • Limitations of mortality indicators • Quality and completeness of data • Non-comparable data sources • Potential measurement of extraneous factors
More ICE indicators to come … • Traumatic Brain Injury mortality indicator • Morbidity indicators • Severity threshold for inclusion • Probability of death • Probability of admission • Functional outcomes/ disability
Questions? E-mail us at MWarner@CDC.GOVorLChen3@cdc.gov For more information on injury data and resources from NCHS, see: www.cdc.gov/nchs/injury.htm.