Download
1 / 38
390 likes | 723 Vues
Solid-liquid Equilibrium and Free Energy Calculation of Hard-sphere, Model protein, and Lysozyme Crystals. Jaeeon Chang Center for Molecular and Engineering Thermodynamics Department of Chemical Engineering University of Delaware. Overview.

E N D
Solid-liquid Equilibrium and Free Energy Calculation of Hard-sphere, Model protein, and Lysozyme Crystals Jaeeon Chang Center for Molecular and Engineering Thermodynamics Department of Chemical Engineering University of Delaware
Overview • Determination of liquid-solid transition using histogram reweighting method and expanded ensemble MC simulations • Fluid-solid phase equilibria of patch-antipatch protein model • The combined simulation approach of atomistic and continuum models for the thermodynamics of lysozyme crystals
Objective To develop a generic method to predict liquid-solid phase equilibria from Monte Carlo simulations. Motivation Methods involving particle insertion scheme used in Gibbs ensemble MC are not applicable to dense liquids and solids. The previous method based on equation of state requires fitting of simulation data to an assumed form of EOS. Kofke’s Gibbs-Duhem integration method requires one known point on the coexistence curve.
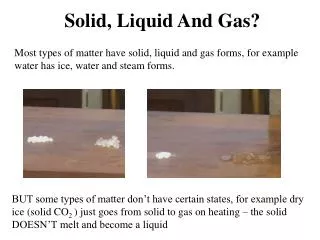
Hard sphere fluid and fcc crystal (Test model) • The simplest nontrivial potential model no vapor-liquid transition, athermal solid-liquid transition • Reference system for perturbation theory • Model for colloid system • Canahan-Starling equation of state for liquid phase
Outline of the Methodology Basic principle Tliq = Tsol pliq = psolliq = sol A series of NPT MC simulations are performed to separately construct equations of state for liquids and solids using histogrm reweighting method To obtain the chemical potentials of liquid branch an accurate estimate at a particular density should be provided either from direct simulations (Widom method, Free energy perturbation method, Bennett acceptance method) or from the integration of the equation of state from from zero density to the liquid density. For the chemical potentials of solid branch, the free energy at a particular density is obtained using Einstein crystal and the expanded ensemble method.
Histograms from NPT Monte Carlo simulations Probability for a single histogram reweighting h Hard spheres V, E
Histogram Reweighting Method in NPT ensemble Composite probability for multiple histograms (not normalized) Ci’s are determined in a self-consistent manner Average properties Chemical potential A known value of free energy is required to specify C0
Free Energy of Solid The classical Einstein crystal as a reference Variation of potential from the reference to the system of interest Einstein crystal (reference) Repulsive core turned on Einstein field turned off The expanded ensemble method: : hopping over subensembles Ref) Lyubartsev et al., J. Chem. Phys. 96, 1776 (1992). Chang and Sandler, J. Chem. Phys. 118, 8390 (2003).
Determination of Solid-liquid Transition • Equilibrium properties p* = 11.79, liq* = 0.944, sol* =1.045, * = 16.30 c.f) Lee and Hoover (1968) p* = 11.70, liq* = 0.943, sol* =1.041
Conclusions • Using the combination of the histogram reweighting and expanded ensemble simulation methods a new generic algorithm for predicting liquid-solid equilibria is proposed. • The liquid-solid equilibria for hard-sphere systems of varying size up to 1372 particles are studied, and the limit for the infinitely large system is accurately determined.
Overview • Determination of liquid-solid transition using histogram reweighting method and expanded ensemble simulations • Fluid-solid phase equilibria of patch-antipatch protein model • The combined simulation approach of atomistic and continuum models for the thermodynamics of lysozyme crystals
Temperature F S L-L Concentration Introduction Background • 3-D protein structure by X-ray crystallography • Crystallization windows correlated with slightly negative values of B2 • L-L equilibria described by isotropic short-range interaction • Anisotropic model necessary for F-S equilibria • Objectives of this work • Understanding of the role of anisotropic interactions on fluid-solid equilibria of protein solutions from ‘exact’ computer simulations • Comparison of the free energies of different crystal structures and phase diagram involving multiple solid phases
3 3 2 1 2 1 5 5 4 4 Patch-antipatch potential model of globular proteins Three patch-antipatch pairs in perpendicular directions A narrow range of orientation : ap = 12º 4~5 for chymotrypsinogen Ref; Hloucha et al., J. Crystal Growth, 232, 195 (2001)
Crystal structures High T Low T Low T orientationally disordered face centered cubic FCC(d) simple cubic SC orientationally ordered face centered cubic FCC(o)
Free energy (Fluid) Thermodynamic integration method over the equation of state
Free energy of the Einstein crystal Constraining potential Free energy
Free energy (Solid) The classical Einstein crystal as a reference Variation of potential from the reference to the system of interest Einstein crystal (reference) Repulsive core turned on Attractions turned on Einstein field turned off The expanded ensemble method: a direct measure of free energy difference Ref) J. Chang and S. I. Sandler, J. Chem. Phys. 118, 8390 (2003)
Coexistence at a fixed temperature T* = 1.0, p* = 1 (isotropic model)
Coexistence for isotropic model Density Osmotic pressure
Coexistence for anisotropic model with p* = 5 Density Osmotic pressure The ordered phases [ SC and FCC(o) ] are stable at low temperatures
Phase diagram for anisotropic model with p* = 5 Chemical potential of solid beyond saturation pressure Saturated solidsPhase diagram FCC(o) cannot be prepared directly from solutions
Conclusions • More than one crystal structures are compatible even with the simple anisotropic protein model. • Phase diagram involving multiple solid phases are determined from the histogram reweighting method.
Overview • Determination of liquid-solid transition using histogram reweighting method and expanded ensemble simulations • Fluid-solid phase equilibria of patch-antipatch protein model • The combined simulation approach of atomistic and continuum models for the thermodynamics of lysozyme crystals J. Phys. Chem. B, 109, 19507 (2005)
Introduction • Protein crystal • Protein crystals are used to determine three-dimensional structure of proteins. • Trial-and-error screening methods to find crystallization conditions • Weak attractive interactions for the crystallization to occur Hen egg white lysozyme (193L) • Lysozyme • Natural antibiotic enzyme to break the cell wall of bacteria • Several crystal forms depending upon the solution conditions ( T, pH, Ionic strength and species) • Solubility, heat of crystallization are known experimentally. • Phase transition between tetragonal (low T) and orthorhombic (high T) forms occurs near the room temperature
Objective and approach • To compare the thermodynamic properties of tetragonal and orthorhombic crystals of hen egg white lysozyme Crystallographic structure Boundary element method NVT Monte Carlo simulation Elec. A Expanded ensemble MC simulation Gibbs-Helmholtz relation vdw U Elec. A Elec. U, S vdw A Thermodynamic properties
NVT Monte Carlo simulations • Potential model (implicit water) • Semi-empirical model of Asthagiri et al., Biophys. Chem. (1999) • 0.5 OPLS force field, r < 6Å • Hamaker interactions ( H = 3.1 kT), r > 6Å • System • 16 protein molecules (rigid body) • NVT MC at experimental density and at 298 K • Translation ~ 0.1Å, Rotation ~ 1º orthorhombic form (PDB 1F0W) tetragonal form (PDB 193L)
Free energy of crystal from expanded ensemble MC Variation of potential from the reference to the system of interest Einstein crystal (known free energy) Einstein field turned off Full interaction = 0 0 < < 1 = 1 The expanded ensemble MC method: hopping over subensembles Ref) Lyubartsev et al., J. Chem. Phys. 96, 1776 (1992). Chang and Sandler, J. Chem. Phys. 118, 8390 (2003).
Boundary element method for electric potential • Protein domain: dielectric const. 4 • Aqueous domain ( a single protein in solution ): dielectric const. 80 • Aqueous domain of the Crystal is in the Donnan equilibrium with the solution. • Optimally linearized Poisson-Boltzmann equation • Electrostatic free energy
Boundary elements and charge distribution in the protein • 1,000-2,000 Triangular elements were obtained using Connolly’s program with subsequent simplification procedure. • The charges are placed at 30 ionizable residues (Asp, Glu, Arg, His, Lys, Tyr) and the C and N termini. • The Henderson-Hasselbalch equation using experimental pKa data.
VDW energy from MC simulations • The VDW interactions in the tetragonal form are less attractive than in the orthorhombic form. • Noticeable variations in the energy among the PDB structures are observed due to the variations in the side chain conformations. • The Lennard-Jones interactions within 6 Å dominate over the water-mediated Hamaker interactions at longer distances.
Free energy of lysozyme crystal (pH 4.5 and I = 0.36 M) • Standard state at 1mol/L : A°/NkT = ln(Λ3/1660) – 1 • The experimental values are close to each other since the transition occurs near 298 K. • Electrostatic contribution to the free energy is repulsive. • The predicted Helmholtz energies are less than the experimental values. Tetragonal Orthorhombic
Energy of crystallization (pH 4.5 and I = 0.36 M) • The VDW contributions play a dominant role in both crystals. • For the tetragonal crystal, the predicted energy is acceptable considering the wide range of the reported experimental values from –40 to –140 kJ/mol. • The less attractive energy from experiment suggests energetically unfavorable release of water molecules from crystal contacts. • The larger disagreement for the orthorhombic crystal form indicates a large difference in the solvation structure. Tetragonal Orthorhombic water release
Entropy of lysozyme crystal (pH 4.5 and I = 0.36 M) • The VDW entropy for the tetragonal form is in good agreement with the mean field theory. • The electrostatic contributions to the entropy are negative, arising from the reorganization of water molecules and ions. • For the tetragonal form, there should be a release of about 4 water molecules upon crystallization ( the entropy change on the melting of ice ~ 22 J/mol/K). water release Tetragonal Orthorhombic
Experimental evidence of distinct hydration structures • A water molecule is counted as a bridging molecule if it is also close to another protein. • Whereas the total number of hydrated water molecules is almost the same, there is a decrease of about ten bridging water molecules for each protein in the orthorhombic crystal forms. • Additional water molecules are expelled from between the contacting surfaces when a lysozyme molecule becomes part of an orthorhombic crystal, which is an energetically less favorable but entropically more favorable process. ~ >
Conclusions • We have carried out Monte Carlo simulations of the hen egg white lysozyme crystals at the atomistic level and the boundary element calculations to solve the Poisson-Boltzmann equation for the electrostatic interactions. • The crystallization energy of the tetragonal structure agrees reasonably well with experimental data, while there is a considerable disagreement for the orthorhombic form. • A large difference in the experimental energy of crystallization between the two crystals indicates energetically unfavorable solvation in the orthorhombic form. • The much higher value of the entropy of the orthorhombic crystal is explained in terms of the entropy gain of the water molecules released during the crystallization.
Acknowledgements • National Science Foundation • Department of Energy • Prof. Stanley Sandler • Prof. Abraham Lenhoff • Dr. Jeffrey Klauda (NIH) • Dr. Stephen Garrison (NIST) • Mr. Gaurav Arora