Download

1 / 22
220 likes | 339 Vues
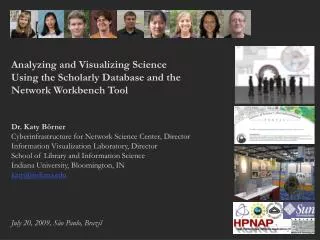
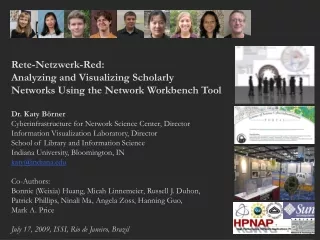
Representing, Analyzing, and Visualizing Scholarly Data in Support of Research Management Dr. Katy Börner Cyberinfrastructure for Network Science Center, Director Information Visualization Laboratory, Director School of Library and Information Science Indiana University, Bloomington, IN

E N D
Representing, Analyzing, and Visualizing Scholarly Data in Support of Research Management Dr. Katy Börner Cyberinfrastructure for Network Science Center, Director Information Visualization Laboratory, Director School of Library and Information Science Indiana University, Bloomington, IN katy@indiana.edu First Author: Thomas Neirynck IV Conferences, Zurich, Schweiz July 5th 2007
Knowledge Management Tool for • The tracking, management, and sense making of data relevant for the daily operation of a medium size scholarly unit such as a research groups, laboratory, or center. Note: • Small research groups with about five students might not require the proposed tool as all data can be easily managed by one person. • Huge groups, e.g., entire departments or schools, with more than 50 different people typically have full-time paid assistants and staff to take care of finances, hiring and firing, information technology, travel arrangements, etc.. Katy Börner, Representing, Analyzing, and Visualizing Scholarly Data in Support of Research Management
Target User Groups • Leaders that need to provide references for current or previous members; report the progress of different projects to different funding agencies in different time intervals, e.g., quarterly or annually. • Group members might include Ph.D. students that need to report their progress on an annual basis, some members are project team leads themselves and are in need to manage the project team and associated publication plans, presentation travels, organized events, as well as the datasets, software, and hardware. • Information technology support staff needs to know what projects and people are affected if certain hardware is replaced or a piece of software is updated. • Funding agencies are interested to see the impact of the work they fund. • Scholars might like to gain a quick overview about the expertise and productivity of a certain unit. They might be interested to know when Ph.D. students become available for hire, if a unit member is available to give a talk at a certain date or is already committed to other travels, etc. Katy Börner, Representing, Analyzing, and Visualizing Scholarly Data in Support of Research Management
Lab/Center Management System http://ivl.slis.indiana.edu Katy Börner, Representing, Analyzing, and Visualizing Scholarly Data in Support of Research Management
Data Entities and Interlinkages Katy Börner, Representing, Analyzing, and Visualizing Scholarly Data in Support of Research Management
Simplified representation of the IVL database schema Katy Börner, Representing, Analyzing, and Visualizing Scholarly Data in Support of Research Management
Data Entry Katy Börner, Representing, Analyzing, and Visualizing Scholarly Data in Support of Research Management
Demo http://ivl.slis.indiana.edu Katy Börner, Representing, Analyzing, and Visualizing Scholarly Data in Support of Research Management
Time series analysis & visualization Katy Börner, Representing, Analyzing, and Visualizing Scholarly Data in Support of Research Management
KM: Katy’s Travels in 2000-2006 Katy Börner, Representing, Analyzing, and Visualizing Scholarly Data in Support of Research Management
Co-authorship network for all publications of InfoVis lab group members in 2005 to 2006 Katy Börner, Representing, Analyzing, and Visualizing Scholarly Data in Support of Research Management
Co-PI Network Katy Börner, Representing, Analyzing, and Visualizing Scholarly Data in Support of Research Management
Mapping the Evolution of Co-Authorship Networks in Information Visualization, 1988 - 2004Ke, Visvanath & Börner, (2004) Won 1st price at the IEEE InfoVis Contest. Katy Börner, Representing, Analyzing, and Visualizing Scholarly Data in Support of Research Management 20
I would like to thank all my colleagues and collaborators. SLIS If not otherwise indicated, this work was conducted at the Information Visualization Laboratory and the Cyberinfrastructure for Network Science Center at Indiana University.