Download
1 / 21
240 likes | 526 Vues
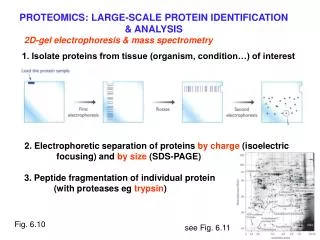
PROTEOMICS: LARGE-SCALE PROTEIN IDENTIFICATION & ANALYSIS. 2D-gel electrophoresis & mass spectrometry. 1. Isolate proteins from tissue (organism, condition…) of interest. 2. Electrophoretic separation of proteins by charge (isoelectric focusing) and by size (SDS-PAGE).

E N D
PROTEOMICS: LARGE-SCALE PROTEIN IDENTIFICATION & ANALYSIS 2D-gel electrophoresis & mass spectrometry 1. Isolate proteins from tissue (organism, condition…) of interest 2. Electrophoretic separation of proteins by charge (isoelectric focusing) and by size (SDS-PAGE) 3. Peptide fragmentation of individual protein (with proteases eg trypsin) Fig. 6.10 see Fig. 6.11
4. Determine precise peptide mass by MALDI-TOF (matrix-assisted laser desorption ionization – time of flight) mass spectrometry 5. Compare aa sequences to genomic data to correlate protein with its gene Fig. 6.12
STRUCTURAL PROTEOMICS - large-scale determination of protein structures Start with gene of interest – cloning, expression, purification of protein X-ray crystallography - crystallize protein & X-ray diffraction analysis NMR spectroscopy - for small proteins or domains (in solution) Protein data bank: www.rcsb.org/pdb/ Nov 2000 = 13,750 structures Nov 2001 = 16,550 Nov 2006 = 40,132 Nov 2008 = 54,559 Nov 2009 = 61,418 Nov 2011 = 76,814
Analysis of protein sequences and structures How similar are hemoglobin a-chain and b-chain? hemoglobin tetramer
Identification of - protein motifs, catalytic centres… - binding to ligands, drugs - interaction with other macromolecules - relatedness to other proteins (homology modelling) clues from protein sequence/structure about biological function For example: EMBL-EBI (European Bioinformatics Institute) www.ebi.ac.uk/Tools/ppsearch/ ExPASy (Swiss Institute of Bioinformatics) www.expasy.org/ www.ncbi.nlm.nih.gov/structure
How to find proteins that interact with protein of interest? 1. Phage display - generate phage library producing collection of fusion proteins between phage coat protein & “ test protein” from genome of interest - hybrid protein will be “displayed” on outer surface of phage - then screen library to find ones having expressed protein which interacts with “test” protein of interest Fig. 6.14
RNA pol II 2. Yeast 2-hybrid system Background info about transcription in eukaryotes Activator domain Transcription factors have 2 domains DNA binding domain gene mRNA Regulatory cis-element But if “bait” & “prey” interact to bring TF domains close together, then transcription occurs If TF domains physically separated, no transcription mRNA
Determining protein-protein interactions using yeast 2-hybrid system - use separate vectors to prepare [1] “bait” fused to DNA binding domain of a yeast transcription factor [2] shotgun library of possible “prey” fused to activation domain of yeast TF - fuse (1) to gene for protein X = “bait” “prey” – generate library where (2) is fused to random coding sequences from organism of interest (eg. human) Fig. 6.15
- co-transform yeast cells (which lack this transcription factor TF) Fig. 6.15 if protein X and “prey” (from library) interact, the 2 domains of yeast TF will be close together (& functional), so activate reporter gene eg if use lacZ reporter gene – blue colour of yeast colony
B B 3. Affinity column chromatography - protein B (“bait”) attached on column to “fish out” the protein (or proteins) which specifically bind to it If bait protein does not interact directly with protein(s) in a complex, they may not be isolated Fig.6.18 or use co-immunoprecipitation (p.182) Fig.6.17
4. Computational approaches to predict protein-protein interactions 10 different organisms … and may be physically close in genome (as well as co-inherited) If 2 genes are functionally-related, expect them to be co-inherited… Do genes 1 and 2 (orange & green) pass this test? - premise that composite (naturally-fused) proteins have direct physical interaction (or functional association) Gene fusion/fission (2 short genes in some organisms vs. one long gene in others) Harrington FEBS Lett. 582:1251, 2008
3. Bioinformatics approach to predict protein-protein interactions - search for one large gene in organism X vs. two separate smaller genes in Y his10 his2 in E.coli in yeast “ HIS2 ” Fig.6.19 Search of complete genomes of E.coli, Haemophilus, Methanococcus & yeast - found 215 cases of “fused vs. split” state Enright et al. Nature 402: 86, 1999
Yeast protein-protein interaction map (from experimental data) - lines connecting dots represent known protein- protein interactions 2002 colour-coded for biological function 2001 Fig. 6.20 red dots = essential proteins (so knockout is lethal) green = non-lethal; orange = slow growth; yellow = unknown effect
“Protein interaction network in Huntington’s disease” - triplet repeat (CAG) expansion disease (p.510) Figure 2. Protein Interaction Network for Huntington’s Disease Comprehensive PPI network for htt [huntingtin protein] Y2H interactors [35 bait and 51 prey proteins & verified in pull down assays], red diamonds; previously published interactors, blue squares; interactors identified from databases HRPD, MINT, and BIND, bridging any two proteins in the extended network, green triangles Htt interactors previously reported and recapitulated in our screens. Goehler et al. Mol Cell 15:853, 2004
Marcotte Nature 402:83, 1999 www.yeastgenome.org
Papers related to questions on 2d mid-term test They double-checked some by RT-PCR microarray profiling RNA-seq
Hawrylycz et al. Nature Sept. 2012 “… a small number of high-quality, clinically unremarkable brains profiled with DNA microarrays for quantitative gene-level transcriptome coverage” “… RNA sequencing methods, which were cost-prohibitive and technologically immature when the project was initiated, hold great promise for elucidating …[brain] transcriptional regulation in the future.” Dopamine pathway genes Different parts of brain
Transcriptional profiles of multi-gene family members (in different parts of human brain) Actin genes different parts of brain different genes Hawrylycz et al. Nature Sept. 2012
Example of highly polymorphic human gene… 3 of its introns have microsatellites which differ in copy number among individuals Factor VIII (F8) blood clotting gene TB: Tibeto-Burman AA: Austro-Asiatic Allele frequency for microsatellite in intron 1 Number of tandem repeats (GTGTGT…) in intron 1 varies among populations in India Saha Haemophilia 17: e928, 2011
“The finished human genome-assemblies comprise several hundred un-sequenced euchromatic gaps, which may be rich in long polypurine/polypyrimidine stretches. “In this study, we sequenced 99% of all three [such] unfinished gaps on human chr 20..”
Barcode tags used in gene overexpression experiments - similar in design to gene deletion experiments discussed in Topic 7 - to track whether having too much protein X is lethal under certain growth conditions… Douglas et al. G3:Genes Genomes Genet 2:1279-89, Oct. 2012