Download
1 / 44
440 likes | 624 Vues
TAU: Recent Advances. KTAU : Kernel-Level Measurement for Integrated Parallel Performance Views TAUg : Runtime Global Performance Data Access Using MPI Aroon Nataraj Performance Research Lab University of Oregon. KTAU: Outline. Introduction Motivations Objectives

E N D
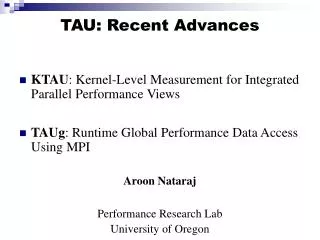
TAU: Recent Advances • KTAU: Kernel-Level Measurement for Integrated Parallel Performance Views • TAUg: Runtime Global Performance Data Access Using MPI Aroon Nataraj Performance Research Lab University of Oregon
KTAU: Outline • Introduction • Motivations • Objectives • Architecture / Implementation Choices • Experimentation – the performance views • Perturbation Study • ZeptoOS – KTAU on Blue Gene / L • Future work and directions • Acknowledgements
Introduction : ZeptoOS and TAU • DOE OS/RTS for Extreme Scale Scientific Computation(Fastos) • Conduct OS research to provide effective OS/Runtime for petascale systems • ZeptoOS (under Fastos) • Scalable components for petascale architectures • Joint project Argonne National Lab and University of Oregon • ANL: Putting light-weight kernel (based on Linux) on BG/L and other platforms (XT3) • University of Oregon • Kernel performance monitoring, tuning • KTAU • Integration of TAU infrastructure in Linux Kernel • Integration with ZeptoOS, installation on BG/L • Port to 32-bit and 64-bit Linux platforms
KTAU: Motivation • Application Performance • user-level execution performance + • OS-level operations performance • Domains: Time and Hardware Perf. Metrics • PAPI (Performance Application Programming Interface) • Exposes virtualized hardware counters • TAU (Tuning and Analysis Utility) • Measures a lot of the interesting user-level entities: parallel application, MPI, libraries … • Time domain • Uses PAPI to correlate counter information to source
KTAU: Motivation • As HPC systems continue to scale to larger processor counts • Application performance more sensitive • New OS factors become performance bottlenecks (E.g. [Petrini’03, Jones’03, other works…]) • Isolating these system-level issues as bottlenecks is non-trivial [from Petrini’03] • Comprehensive performance understanding • Observation of all performance factors • Relative contributions and interrelationship: can we correlate?
KTAU: Motivation continued…Program - OS Interactions • Program OS Interactions - Direct vs. Indirect Entry Points • Direct - Applications invoke the OS for certain services • Syscalls (and internal OS routines called directly from syscalls) • Indirect - OS takes actions without explicit invocation by application • Preemptive Scheduling • (HW) Interrupt handling • OS-background activity (keeping track of time and timers, bottom-half handling, etc) • Indirect interactions can occur at any OS entry (not just when entering through Syscalls) • Direct Interactions easier to handle • Synchronous with user-code and in process-context • Indirect Interactions more difficult to handle • Usually asynchronous and in interrupt-context: Hard to measure and harder to correlate/integrate with app. Measurements • But can argue: Indirect interactions may be unrelated to task? Why measure?
KTAU: Motivation continued…Kernel-wide vs. Process-centric • Kernel-wide - Aggregate kernel activity of all active processes in system • Understand overall OS behavior, identify and remove kernel hot spots. • Cannot show what parts of app. spend time in OS and why • Process-centric perspective - OS performance within context of a specific application’s execution • Virtualization and Mapping performance to process • Interactions between programs, daemons, and system services • Tune OS for specific workload or tune application to better conform to OS config. • Expose real source of performance problems (in the OS or the application)
KTAU: Motivation continued…Existing Approaches • User-space Only measurement tools • Many tools only work at user-level and cannot observe system-level performance influences • Kernel-level Only measurement tools • Most only provide the kernel-wide perspective – lack proper mapping/virtualization • Some provide process-centric views but cannot integrate OS and user-level measurements • Combined or Integrated User/Kernel Measurement Tools • A few powerful tools allow fine-grained measurement and correlation of kernel and user-level performance • Typically these focus only on Direct OS interactions. Indirect interactions not merged. • Using Combinations of above tools • Without better integration, does not allow fine-grained correlation between OS and App. • Many kernel tools do not explicitly recognize Parallel workloads (e.g. MPI ranks) • Need an integrated approach to parallel perf. observation, analyses
Support low-overhead OS performance measurement at multiple levels of function and detail Provide both kernel-wide and process-centric perspectives of OS performance Merge user-level and kernel-level performance information across all program-OS interactions Provide online information and the ability to function without a daemon where possible Support both profiling and tracing for kernel-wide and process-centric views in parallel systems Leverage existing parallel performance analysis tools Support for observing, collecting and analyzing parallel data KTAU: High-Level Objectives
KTAU: Outline • Introduction • Motivations • Objectives • Architecture / Implementation Choices • Experimentation – the performance views • Perturbation Study • ZeptoOS – KTAU on Blue Gene / L • Future work and directions • Acknowledgements
KTAU: Arch. / Impl. Choices • Instrumentation • Static Source instrumentation • Macro Map-ID: Map block of code and process-context to unique index (dense id-space) – easy array lookup. • Macro Start, Stop – provide the mapping index and process-context is implicit • Measurement • Differentiate between ‘local/self’ and ‘inter-context’ access. HPC codes primarily use ‘self’. • Store performance data in PCB (task_struct) • Integrating Kernel/User Performance state • Don’t assume synchronous kernel-entry or process-context • Have to use memory mapping between kernel and appl. State • Pinning shared state in memory • Kernel Call Groups – program-OS interactions summary • Analyses and Visualization – Use TAU facilities
KTAU: Controlled Experiments • Controlled Experiments • Exercise kernel in controlled fashion • Check if KTAU produces the expected correct and meaningful views • Test machines • Neutron: 4-CPU Intel P3 Xeon 550MHz, 1GB RAM, Linux 2.6.14.3(ktau) • Neuronic: 16-node 2-CPU Intel P4 Xeon 2.8GHz, 2GB RAM/node, Redhat Enterprise Linux 2.4(ktau) • Benchmarks • NPB LU application[NPB] • Simulated computational fluid dynamics (CFD) application. A regular-sparse, block lower and upper triangular system solution. • LMBENCH[LMBENCH] • Suite of micro-benchmarks exercising Linux kernel • A few others not shown (e.g. SKAMPI)
KTAU: Controlled Examples continued… Profiling
Merging App / OS Traces MPI_Send OS Routines KTAU: Controlled Examples continued…Tracing Fine-grained Tracing Shows detail inside interrupts and bottom halves Using VAMPIR Trace Visualization [VAMPIR]
KTAU: Larger-Scale Runs • Run parallel benchmarks on larger-scale (128 dual-cpu nodes) • Identify (and remove) system-level performance issues • Understand perturbation overheads introduced by KTAU • NPB benchmark: LU Application[NPB] • Simulated computational fluid dynamics (CFD) application. A regular-sparse, block lower and upper triangular system solution. • ASC benchmark: Sweep3D[Sweep3d] • Solves a 3-D, time-independent, neutron particle transport equation on an orthogonal mesh. • Test machine: Chiba-City Linux cluster (ANL) • 128 dual-CPU Pentium III, 450MHz, 512MB RAM/node, Linux 2.6.14.2 (ktau) kernel, connected by Ethernet
KTAU: Larger-Scale Runs • By chance experienced problems on Chiba • Initially ran NPB-LU and Sweep3D codes on 128x1 configuration • Then ran on 64x2 configuration • Extreme performance hit (72% slower!) with the 64x2 runs • Used KTAU views to identify and solve issues iteratively • Eventually brought performance gap to 13% for LU and 9% for Sweep.
KTAU: Larger-scale Runs User-level MPI_Recv MPI_Recv OS Interactions Two ranks - relatively very low MPI_Recv() time. Two ranks - MPI_Recv() diff. from Mean in OS-SCHED.
KTAU: Larger-scale Runs Voluntary Scheduling Preemptive Scheduling Note: x-axis log scale Two ranks have very low voluntary scheduling durations. (Same) Two ranks have very large preemptive scheduling.
KTAU Larger-scale Runs ccn10 Node-level View Interrupt Activity NPB LU processes PID:4066, PID:4068 active. No other significant activity! Why the Pre-emption? 64x2 Pinned: Interrupt Activity Bimodal across MPI ranks.
Approx. 100% longer Many more OS-TCP Calls KTAU Larger-scale Runs Use ‘Merged’ performance data to identify imbalance.Why does purely compute bound region have lots of I/O? TCP within Compute : Time TCP within Compute : Calls 100% More background OS-TCP activity in Compute phase. More imbalance!
KTAU Larger-scale Runs Cost / Call of OS-level TCP OS-TCP in SMP Costlier • IRQ-Balancing blindly distributes interrupts and bottom-halves. • E.g.: Handling TCP related BH in CPU-0 for LU-process on CPU-1 • Cache issues! [COMSWARE]
KTAU Perturbation Study • Five different Configurations • Base: Vanilla kernel, un-instrumented benchmark • Ktau-Off: Kernel patched with Ktau and instrumentations compiled-in. But all instrumentations turned Off (boot-time control) • Prof-All: All kernel instrumentations turned On. • Prof-Sched: Only scheduler subssystem’s instrumentations turned on • Prof-All+TAU: ProfAll, but also with user-level Tau instrumentation enabled • NPB LU application benchmark: • 16 nodes, 5 different configurations, Mean over 5 runs each • ASC Sweep3D: • 128 nodes, Base and Prof-All+TAU, Mean over 5 runs each. • Test machine: Chiba-City ANL
KTAU Perturbation Study Sweep3d on 128 Nodes Base ProfAll+TAU Elapsed Time: 368.25 369.9 % Avg Slow.: 0.49% Complete Integrated Profiling Cost under 3% on Avg. and as low as 1.58%. Disabled probe effect. Single instrumentation very cheap. E.g. Scheduling.
KTAU: Outline • Introduction • Motivations • Objectives • Architecture / Implementation Choices • Experimentation – the performance views • Perturbation Study • ZeptoOS – KTAU on Blue Gene / L • Future work and directions • Acknowledgements
ZeptoOS: KTAU On Blue Gene / L (BG/L) • I/O Node • Open source modified Linux Kernel (2.4, 2.6) - ZeptoOS • Control I/O Daemon (CIOD) handles I/O syscalls from Compute nodes in pset. • Compute Node • IBM proprietary (closed-source) light-weight kernel • No scheduling or virtual memory support • Forwards I/O syscalls to CIOD on I/O node • KTAU on I/O Node: • Integrated into ZeptoOS config and build system. • Require KTAU-D (daemon) as CIOD is closed-source. • KTAU-D periodically monitors sys-wide or individual process • Visualization of trace/profile of ZeptoOS, CIOD using Paraprof, Vampir/Jumpshot.
KTAU: On Bg/L continued…Early Experiences CIOD Kernel Trace zoomed-in (running iotest benchmark)
KTAU: On Bg/L continued…Early Experiences Correlating CIOD and RPC-IOD Activity
KTAU: Future Work • Dynamic measurement control - enable/disable events w/o recompilation or reboot • Improve performance data sources that KTAU can access - E.g. PAPI • Improve integration with TAU’s user-space capabilities to provide even better correlation of user and kernel performance information • full callpaths, • phase-based profiling, • merged user/kernel traces • Integration of Tau, Ktau with Supermon (possibly MRNet?), TAUg (next) • Porting efforts: IA-64, PPC-64 and AMD Opteron • ZeptoOS: Planned characterization efforts • BGL I/O node • Dynamically adaptive kernels
TAUg: Outline • Overview • Motivation • Design • Programming Interface • Experimentation • Overheads
TAUg: Motivation • While an application is running, there exists a virtual global performance state • All events, profiled on all processes and threads • Need runtime, application-level access to the state • Load balancing • CQoS: Computational Quality of Service • Other adaptive runtime behavior • Need scalable solution • Many large applications already use MPI
TAU generates and provides access to the local performance state MPI provides scalable communication infrastructure to promote the local states to the global state TAUg (global) performance view Subset of events in the local performance state TAUg (global) performance communicator Subset of MPI processes in the application Querying the view provides selective access to the global performance state TAUg: Overview
TAUg Programming Interface • TAU_REGISTER_VIEW() • Selects a subset of events • TAU_REGISTER_COMMUNICATOR() • Selects a subset of processes • TAU_GET_VIEW() • Input: view ID, communicator ID, exchange type (all-to-all, one-to-all, all-to-one), source/sink process rank (ignored for all-to-all communication) • Output: vector of performance data • Uses scalable MPI collectives to exchange data
TAUg experiments • Simulation application • Demonstrates functionality of TAUg in a simulated heterogeneous cluster to provide access to global performance view for load balancing • ASC benchmark: sPPM • Solves a 3D gas dynamics problem on a uniform Cartesian mesh using a simplified version of the PPM (Piecewise Parabolic Method) code. • ASC benchmark: Sweep3D • Solves a 3-D, time-independent, neutron particle transport equation on an orthogonal mesh. • Test machines: MCR, ALC (LLNL)
TAUg Overhead: Simulation Less than 0.1% overhead, one event, all processes, 10 timesteps in ~62.4 seconds for 128 CPUs, weak scaling Load-balancing gave 28% speedup
TAUg Overhead: sPPM Less than 0.1% overhead, all events, all processes, 20 timesteps in ~120 seconds for 64 CPUs, weak scaling
TAUg Overhead: Sweep3D Less than 1.3% overhead, one event, all processes, 200 timesteps in ~250 seconds for 512 CPUs, strong scaling
Support Acknowledgements • Department of Energy’s Office of Science (contract no. DE-FG02-05ER25663) and • National Science Foundation (grant no. NSF CCF 0444475)
References • [petrini’03]:F. Petrini, D. J. Kerbyson, and S. Pakin, “The case of the missing supercomputer performance: Achieving optimal performance on the 8,192 processors of asci q,” in SC ’03 • [jones’03]: T. Jones and et al., “Improving the scalability of parallel jobs by adding parallel awareness to the operating system,” in SC ’03 • [PAPI]: S. Browne et al., “A Portable Programming Interface for Performance Evaluation on Modern Processors”. The International Journal of High Performance Computing Applications, 14(3):189--204, Fall 2000. • [VAMPIR]: W. E. Nagel et. al., “VAMPIR: Visualization and analysis of MPI resources,” Supercomputer, vol. 12, no. 1, pp. 69–80, 1996. • [ZeptoOS]: “ZeptoOS: The small linux for big computers,” http://www.mcs.anl.gov/zeptoos/ • [NPB]: D.H. Bailey et. al., “The nas parallel benchmarks,” The International Journal of Supercomputer Applications, vol. 5, no. 3, pp. 63–73, Fall 1991.
References • [Sweep3d]: A. Hoise et. al., “A general predictive performance model for wavefront algorithms on clusters of SMPs,” in International Conference on Parallel Processing, 2000 • [LMBENCH]: L. W. McVoy and C. Staelin, “lmbench: Portable tools for performance analysis,” in USENIX Annual Technical Conference, 1996, pp. 279–294 • [TAU]: “TAU: Tuning and Analysis Utilities,” http://www.cs.uoregon.edu/research/paracomp/tau/ • [KTAU-BGL]: A. Nataraj, A. Malony, A. Morris, and S. Shende, “Early experiences with ktau on the ibm bg/l,” in EuroPar’06, European Conference on Parallel Processing, 2006. • [KTAU]: A. Nataraj et al., “Kernel-Level Measurement for Integrated Parallel Performance Views: the KTAU Project” (under submission)
Team • Aroon Nataraj, PhD Student – KTAU • Kevin Huck, PhD Student - TAUg • Prof. Allen D Malony • Dr. Sameer Shende, Senior Scientist • Alan Morris, Senior Software Engineer • Suravee Suthikulpanit , MS Student (Graduated) - KTAU