Project Time Management
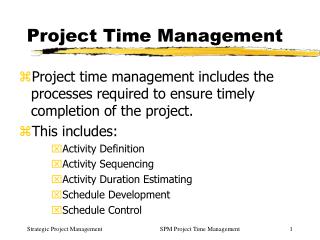
Project Time Management. Activity Definition, Resourcing and Scheduling. Key Tasks. Activity Definition developing the work breakdown structure Activity Sequencing identifying relationships between activities Activity Estimation

Project Time Management
E N D
Presentation Transcript
Project Time Management Activity Definition, Resourcing and Scheduling
Key Tasks • Activity Definition • developing the work breakdown structure • Activity Sequencing • identifying relationships between activities • Activity Estimation • ‘guessing’ the amount of time and resource required for a particular activity • Schedule Development • putting the Sequence and Estimation data together into a ‘plan’, a project schedule • Schedule Control • controlling and managing the project schedule (this will be dealt with a separate lecture)
Activity Definition • Need to know the Scope, The Time Constraints and the available Budget • Ideally these should be considered in this order • Activity Definition • Sequence the activities • Estimate the duration (time = money) • This should result in a Work Breakdown structure (WBS) • A list of key tasks, with sub-tasks identified where possible or where required • Resource Estimates against lowest level tasks – these can be aggregated back up into an overall resource requirement • WBS should be reviewed regularly – break larger tasks down into more detailed tasks at key points • transfer between stages of waterfall methodology or the phases of an iterative development for example
Activity Sequencing • Identify the order in which tasks can or must be performed • Identify dependencies between tasks • Mandatory – you cannot test code until it is written • Discretionary – don’t start design until analysis is complete • External – delivery of new hardware • Identify tasks that can be performed in parallel (i.e. they are not inter-dependent) • Identify where tasks can overlap (Coding and testing usually overlap at a high level, with low-level mandatory dependencies between parts of the system) • May need client input at this stage to identify areas of priority – i.e. if several tasks can be performed in parallel, is any particular task more important to the client than the others? • This stage is essential if project management tools are to be used • Allows the development of Network Diagrams, Gantt Charts and Critical path Analysis
Task Dependencies (from task to task) • Finish-to-Start • The to task cannot start until the from task has been finished (most common type of dependency) • Start-to-Start • The to task can only be started if the from task has been started • Finish-to-Finish • The to task can only be finished if the from task has been completed • Start-to-Finish • The from task must start before the to task can be finished (not used very often) • Resource Dependencies • Two (independent?) tasks may not be able to use the same resource at the same time • These can catch you out!
Activity Estimation • Need to estimate Actual Time (effort – man days?) and Elapsed Time (duration - just days) • Resources are assigned to tasks – you need to know how much ‘work’ a resource can do in a specific period of time • Resources can rarely dedicate 100% of their time to one job, make sure your plans do not assume that they do • Does involve guesswork, err on the side of caution • Allocate resource estimates at the lowest level of the Work Breakdown Structure • May involve ‘external’ resources (delivery of equipment or scheduling a meeting for example)
Activity Scheduling • Uses all of the data and information collected thus far to provide estimated start and end dates for a project • Aim is to produce a realistic and achievable schedule as a basis for monitoring progress as the project progresses • Common scheduling tools and techniques • Gantt Charts • Critical Path Analysis (Network Diagram) • PERT Analysis (often confused with network Diagrams)
Critical Path Analysis (Network Diagram) • Similar to Gantt chart but shows each task as a Box • Often confused with a P E R T Chart • Enter details of earliest start date and task duration (giving the earliest end date) • taking into account any dependencies along the way • This will enable an end date to be derived • You can then work back and enter the latest end-date and latest start date for a task • The difference between the latest start date and earliest start date is known as the Float • The critical path is the sequence of tasks that have no float time shown • The only way to introduce float is to either start the whole project earlier, or finish it later
PERT Analysis • Program Evaluation and Review Technique • A network analysis method which is used when there is a high degree of uncertainty about activity duration estimates • Applies the critical path technique to a weighted average duration estimation • These durations are then used in a network diagram as per the previous example • Uses probabilistic time estimates (in days), based on: • Optimistic estimate • Most likely duration • Pessimistic estimate • The Pert Weighted Average (PWA) duration is calculated as follows PWA = optimistic time+4 * most likely time + pessimistic time ------------------------------------------------------- 6
Scheduling Tips • Review the plan / schedule regularly • As the project progresses, vague details should become more firm – the WBS should become finer-grained • Plan with contingency in mind, do not schedule resources to 100% of their availability • If in doubt, over-estimate the duration of an activity • Track your actual progress against the schedule • Make sure you identify the critical path, and also which tasks can be done ‘whenever’ • If you come to a stop with one task, use the schedule to identify an appropriate alternative task to start instead
Practical work for this week • Download, or Print off the MS Project example worksheet from WebCT • Have a go at producing a Gantt chart – see if you can spot any resource issues and fix them • everyone’s will be different as you will probably choose different dependencies • Use Visio and have a go at producing a Network Diagram • Decide if you are going to produce a schedule for your Project and if so, in what format
Summary • Planning and Scheduling enables a picture of a project to be produced • This can be used to manage workloads, track progress and communicate responsibilities and progress • In order to produce an effective schedule you must • Define the activities to be undertaken (WBS) • Sequence the activities, identifying any dependencies • Estimate the resources required (don’t forget that most resources can only be used for a single task at any one time) • ‘guessing’ the amount of time and resource required for a particular activity • Develop a Schedule (Gantt or Network Diagram) • This process is very useful for project management purposes • However, care must be taken not to spend too much time fiddling with the finer details of the plan