Download
1 / 13
140 likes | 283 Vues
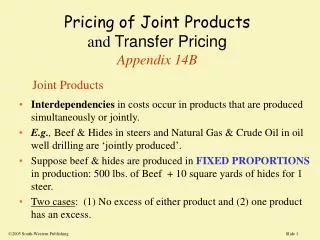
Pricing of Joint Products and Transfer Pricing Appendix 14B. Interdependencies in costs occur in products that are produced simultaneously or jointly. E.g. , Beef & Hides in steers and Natural Gas & Crude Oil in oil well drilling are ‘jointly produced’.

E N D
Pricing of Joint Productsand Transfer PricingAppendix 14B • Interdependencies in costs occur in products that are produced simultaneously or jointly. • E.g., Beef & Hides in steers and Natural Gas & Crude Oil in oil well drilling are ‘jointly produced’. • Suppose beef & hides are produced in FIXED PROPORTIONS in production: 500 lbs. of Beef + 10 square yards of hides for 1 steer. • Two cases: (1) No excess of either product and (2) one product has an excess. Joint Products 2005 South-Western Publishing
Steers:The Case with No Excess of Either Hides or Beef Two Demand Curves: Hides (H) & Beef (B) Two MR Curves: Hides & Beef MRB DH DB steers (T) MRH
2 MCT MRT Find where MRT = MCT to find the optimal of steers. DH DB steers (T) MRH
3 MRT MCT At the optimal number of steers, find the prices of beef & hides on their respective demand curves PB PH DH DB steers (T) MRH T
Suppose the Adkin’s Diet encouragesmore demand for beef • Demand for beef shifts up and out • MR for steers shifts up and out • The optimal number of steers rises • The price of beef rises, but… the price of hides declines. • Inverse movement in the prices for joint products is seen in natural gas and oil prices as well.
Excess of One of the Joint Products • Excess means the price would be ZERO • The solution is to hold back some of the excess to reach the Unit Elastic Point on the Demand Curve. • This Maximizes Total Revenue.
Transfer Pricing • Vertically integrated firms “sell” intermediate goods from one division to the other. The internal price used is called the transfer price. Car Frames Fisher Body GM Chevy Division Transfer prices paid Fisher Body automobile Frames (a division of GM) sells to Chevrolet (another division of GM) GM Chevrolet Division Buys Fisher Body Car Frames
Transfer Pricing serves two functions: • 1. It measures of the marginal value of the resource • It provides a performance measures of resources used, including the total value of resources • Each division can be a profit center. For International Firms, transfer pricing may assist in reducing worldwide taxation, although the ability to reduce taxation is limited since the IRS requires arm’s length prices.
Create Transfer Prices Similar to Competitive Market Prices • Disagreementsacross divisions are common • “Selling” Division wants a HIGH transfer price! • “Buying” Division wants a LOW transfer price! • When External Marketsexist, use those prices for transfer (a market-based competitive price) sell to others @ “P” final car assembly motor assembly purchase motors from others @ “P”
Transfer PricingWith No External Markets • When no external markets exist, use the MC of the transferred good. • Often, however, the MC is a function of output. • Marketing and Production steps (M & P) • Transfer price is PT = MC P on following figure
Find Where MCM+P = MR MCM + PT MCM+P MCP P MCM PT D Q0 MR Figure 14B.5
Transfer Pricing and Profit Maximization • Once a firm uses the transfer price, either from external markets or from analysis of the MC as in PT, the whole firm maximizes profits. • Suppose a firm uses a higher price than PT, call it PHigher to make the production group happier. • The sum of the MCM plus PHigher is given at the next slide, creating the appearance of a cost increase. • Quantity declines from Q0 to Q1 and price is artificially increased from P0 to P1.
Using a higher transfer price hurts profits as quantity declines andprice rises PHigher + MCM PT + MCM MCM+P MCP P1 P0 MCM PHigher PT D Q1 Q0 MR