Download
1 / 23
230 likes | 477 Vues
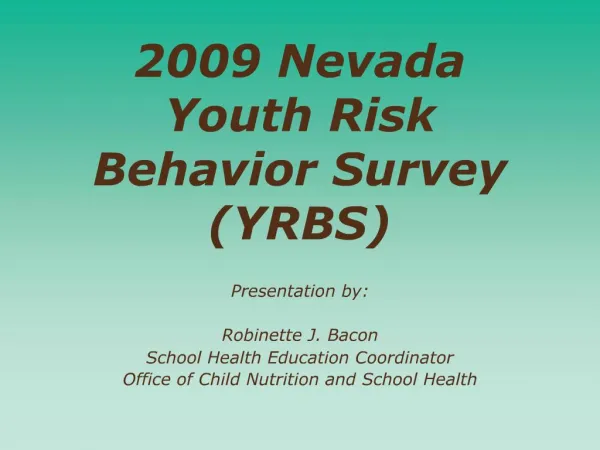
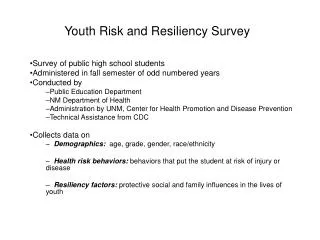
Youth Risk and Resiliency Survey. Survey of public high school students Administered in fall semester of odd numbered years Conducted by Public Education Department NM Department of Health Administration by UNM, Center for Health Promotion and Disease Prevention

E N D
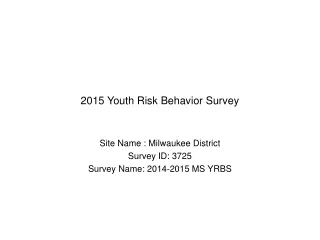
Youth Risk and Resiliency Survey Survey of public high school students Administered in fall semester of odd numbered years Conducted by Public Education Department NM Department of Health Administration by UNM, Center for Health Promotion and Disease Prevention Technical Assistance from CDC Collects data on Demographics: age, grade, gender, race/ethnicity Health risk behaviors: behaviors that put the student at risk of injury or disease Resiliency factors: protective social and family influences in the lives of youth
Prevalence of Drug and Alcohol Use (%), NM and US, 2005 *Among 40 participating states Source: New Mexico Department of Health and New Mexico Public Education Department; CDC
Prevalence of Drug and Alcohol Use (%), NM and US, 2005 *Among 40 participating states Source: New Mexico Department of Health and New Mexico Public Education Department; CDC
Prevalence of Drug and Alcohol Use (%), NM and US, 2005 *Among 40 participating states Source: New Mexico Department of Health and New Mexico Public Education Department; CDC
Prevalence of Drug and Alcohol Use (%), NM and US, 2005 *Among 40 participating states Source: New Mexico Department of Health and New Mexico Public Education Department; CDC
Prevalence of Drug and Alcohol Use (%), NM and US, 2005 *Among 40 participating states Source: New Mexico Department of Health and New Mexico Public Education Department; CDC
Prevalence of Drug and Alcohol Use (%), NM and US, 2005 *Among 40 participating states Source: New Mexico Department of Health and New Mexico Public Education Department; CDC
Prevalence of Drug and Alcohol Use (%), NM and US, 2005 *Among 40 participating states Source: New Mexico Department of Health and New Mexico Public Education Department; CDC
Prevalence of Drug and Alcohol Use (%), NM and US, 2005 *Among 40 participating states Source: New Mexico Department of Health and New Mexico Public Education Department; CDC
Prevalence of Current Methamphetamine Use (%), Grades 9-12, 2003 and 2005 YRRS Bold font indicates statistically significant difference for that survey year Source: New Mexico Department of Health and New Mexico Public Education Department
Prevalence of Current Methamphetamine Use (%), Grades 9-12, 2003 and 2005 YRRS Source: New Mexico Department of Health and New Mexico Public Education Department
Prevalence of Concurrent Drug Use Grades 9-12, 2003 and 2005 YRRS Source: New Mexico Department of Health and New Mexico Public Education Department
Prevalence of Concurrent Drug Use Grades 9-12, 2003 and 2005 YRRS Source: New Mexico Department of Health and New Mexico Public Education Department
Prevalence of Concurrent Drug Use Grades 9-12, 2003 and 2005 YRRS Source: New Mexico Department of Health and New Mexico Public Education Department
Prevalence of Concurrent Drug Use Grades 9-12, 2003 and 2005 YRRS Source: New Mexico Department of Health and New Mexico Public Education Department
Prevalence of Concurrent Drug Use Grades 9-12, 2003 and 2005 YRRS Students who used meth or heroin were using more drugs concurrently Source: New Mexico Department of Health and New Mexico Public Education Department
Persistent Feelings of Sadness and Hopelessness by Current Drug UseGrades 9-12, 2003 and 2005 YRRS No Drug Use Drug Use Percent (%) with feelings of sadness and hopelessness Source: New Mexico Department of Health and New Mexico Public Education Department
Persistent Feelings of Sadness and Hopelessness by Current Drug UseGrades 9-12, 2003 and 2005 YRRS No Drug Use Drug Use MethamphetamineNo Meth use HeroinNo Heroin use CocaineNo Cocaine use MarijuanaNo Marijuana use Percent (%) with feelings of sadness and hopelessness Source: New Mexico Department of Health and New Mexico Public Education Department
Suicide Attempt in the Past Year by Current Drug UseGrades 9-12, 2003 and 2005 YRRS No Drug Use Drug Use MethamphetamineNo Meth use HeroinNo Heroin use CocaineNo Cocaine use MarijuanaNo Marijuana use Percent (%) reporting suicide attempt Source: New Mexico Department of Health and New Mexico Public Education Department
Protective Factors and Current Methamphetamine Use, Grades 9-12, 2003 and 2005 YRRS Source: New Mexico Department of Health and New Mexico Public Education Department
Protective Factors and Current Methamphetamine Use, Grades 9-12, 2003 and 2005 YRRS Source: New Mexico Department of Health and New Mexico Public Education Department
Protective Factors and Current Methamphetamine Use, Grades 9-12, 2003 and 2005 YRRS Source: New Mexico Department of Health and New Mexico Public Education Department
Protective Factors and Current Methamphetamine Use, Grades 9-12, 2003 and 2005 YRRS Source: New Mexico Department of Health and New Mexico Public Education Department