Download
1 / 21
210 likes | 379 Vues
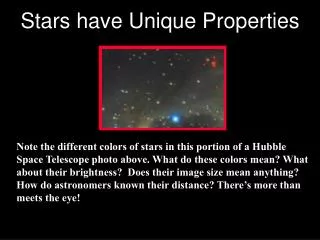
The Properties of Stars. Distance and Intrinsic Brightness. In 6 months, the angular position of X relative to the background stars changes by an amount q . Half of q is the parallax angle p. Line of Sight 6 Months Later. p. Initial Line of Sight. Photograph on Date 1.

E N D
The Properties of Stars Distance and Intrinsic Brightness
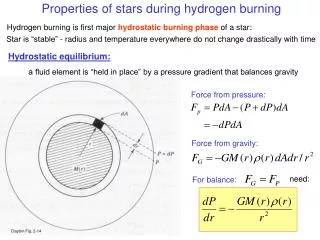
In 6 months, the angular position of X relative to the background stars changes by an amount q.Half of q is the parallax angle p. Line of Sight 6 Months Later p Initial Line of Sight Photograph on Date 1 Photograph on Date 2 Trigonometric Parallax To measure the distance to star X, photograph it on two dates separated by 6 months.In the figure, A and B are the positions of Earth on these two dates. X B S A Consider triangle BSX: BS = 1 AU, SX = d = the unknown distance, and BXS = p = the parallax angle measured from the photographs.
B 1 AU p X d S The distances to stars are so large that the AU is not a convenient unit for stellar distances. The distance unit most commonly used is the parsec. 1 parsec = 1 pc = 206,265 AU = 3.26 light years. In these units, the distance formula is BSX can be solved for d. Since the angle p is small for all stars, the small angle formula can be used. The result is where p is in arcseconds and d is in AU’s. ExampleProcyon has a parallax of 0.29". Calculate the distance to Procyon (a) in parsecs and (b) in light years..
Absolute Magnitude and Luminosity The apparent magnitude of a star is defined by the equation where mA is the magnitude of star A, mB is the magnitude of star B, FA is the flux from star A, and FB is the flux from star B. The flux tells how bright a star appears to the detector. The luminosity of a star is the total electromagnetic energy it emits in a unit of time. Two stars can have the same luminosity and very different apparent magnitudes. Alpha Centauri A and the Sun, for example, are both spectral class G2 stars and have about the same luminosity L = 3.86×1026 W. On the other hand, the apparent magnitude of Alpha Centauri A is 0.1 and the apparent magnitude of the Sun is –26.8. The difference is due to the fact that the Sun is much closer to us than Alpha Centauri A is. In order to make absolute brightness comparisons among stars, we calculate how bright they would appear if they were all at the same distance from the Sun. The standard distance used is 10 pc. The absolute magnitude M of a star is defined as the apparent magnitude it would have if it were at the standard distance of 10 parsecs.
mv = apparent magnitude, M = absolute magnitude, d = distance in parsecs The Relation between Apparent Visual Magnitude and Absolute Visual Magnitude Due to the inverse square law for radiation, the apparent and absolute magnitudes of a star are related by the following equation. Because m - M can be used to calculate the distance to a star, it is called the star’s distance modulus. Example The distance to Alpha Centauri A is 4.37 ly and its apparent magnitude is 0.1. Calculate its absolute magnitude.
Example The absolute bolometric magnitude of Vega is 0.20 and its surface temperature is 9900 K. The Sun’s absolute bolometric magnitude is 4.76. Calculate the luminosity of Vega.
Example Vega’s luminosity is 66.7 times the luminosity of the Sun, and its surface temperature is 9900 K. What is its radius?
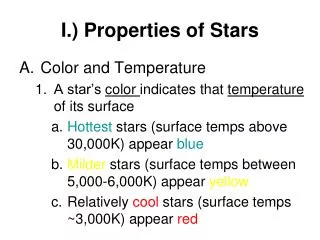
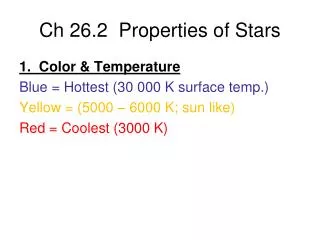
40,000 K 20,000 K 10,000 K 7500 K 5500 K 4500 K 3000 K Dependence of Stellar Spectra on Temperature(Spectral Classification)
FV FB FV FB 3400 K Star: 15,000 K Star: Color Indices It is useful to measure the magnitude of a star through colored filters. One standard set (called the UBV system) consists of filters that transmit a narrow range around 350 nm (ultraviolet), 435 nm (blue), and 555nm (green = visual). The apparent magnitudes measured through these filters are denoted by U, B, and V respectively. The difference between B and V, called the B – V color index, is closely related to the temperature of the star. This can be understood by referring to the continuous spectrum of stars with different temperatures. Notice that FV is greater than FB for the cooler star, but FB is greater than FV for the hotter star. This implies that B > V for the cooler star, but B < V for the hotter star.
Bright Supergiants Supergiants Bright Giants Giants Subgiants Main Sequence White Dwarfs The Hertzsprung-Russel Diagram Stars of the same spectral class can be distinguished from one another by using the luminosity effect to determine their size. It is found that, when we consider the data for a large number of stars, the points on the Hertzsprung-Russel diagram are approximately as shown below. There are very few stars that don’t have MV and B – V that plot near one of the lines in the graph. Based on this, we classify stars by luminosity as well as spectral class. The luminosity classes are Ia bright supergiant Ib supergiant II bright giant III giant IV subgiant V main sequence
From “An Atlas of Stellar Spectra” by Morgan, Keenan, and Kellman The Luminosity Effect • In a dense stellar atmosphere, the atoms collide more frequently than in a low density stellar atmosphere. • The collisions broaden the absorption lines in the star’s spectrum. • Giant stars are larger and less dense than main sequence stars, so their absorption lines are narrower than those of main sequence stars. • The spectra shown above illustrate this effect. Notice that the absorption lines in the spectra of the giant (13 Mono ) and supergiant (HR 1040) stars are narrower than the absorption lines in the main sequence star a Lyrae (Vega). • This enables us to use the star’s spectrum to determine its luminosity as well as its temperature.