Download
1 / 21
210 likes | 225 Vues
Explore how a Tacoma Community Land Trust is tackling gentrification by offering affordable homeownership opportunities for low-income residents, ensuring homes remain affordable long-term.

E N D
Disrupting Gentrification:Tacoma Community Land Trust Michael Monroe RE: 370 Data Modeling Final Project
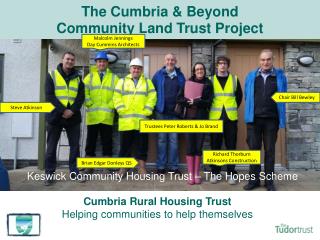
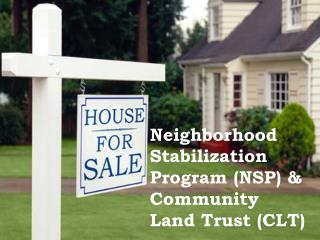
Community Land Trusts • Nonprofit community organization • Homeownership opportunities for low-income people • Homes stay affordable in perpetuity
Community Land Trusts • Nonprofit community organization • Homeownership opportunities for low-income people • Homes stay affordable in perpetuity
Community Land Trusts • Nonprofit community organization • Homeownership opportunities for low-income people • Homes stay affordable in perpetuity
City of Tacoma • Population: 211,277 • Median Income: $53,553 • Racial Demographics: • African American: 10.1% • Asian: 9.1% • Hispanic or Latino: 11.3% • White: 59.7% • Avg. Commute: 27 mins Source: Census.gov Quick Facts
Layers • Proximity to Superfund sites • Median Home Value • Crime Index
Layers • Educational Attainment • Percentage Renter Occupied
Methods • Data at Block Group • Layer for each dataset • Layers converted to raster images • Raster layers transformed to common scale (1 – 10) • Rasters combined with equal weight • (Weighted Sum)
Methods • Data at Block Group • Layer for each dataset • Layers converted to raster images • Raster layers transformed to common scale (1 – 10) • Rasters combined with equal weight • (Weighted Sum)
Proximity to Superfund Sites • Dark green furthest from superfund sites • Low scoring areas in Port of Tacoma and heavy industrial sectors
Median Home Value • High values near water • Limited variance in value in central areas
Crime Index • Lowest crime in dark green • National average crime index is 100 • Some areas score 400+ or 3 times as much crime as the national average
Educational Attainment • Education operationalized as percentage of population with Bachelors degree or higher • Highest scores in wealthiest areas
Percentage Renter Occupied • Lowest percentage of renters near water • Higher percentage of renters near TCC / UPS and Hilltop neighborhood
Future Improvements • Access to Healthy Foods • Exclude Upper Threshold of Home Values • Interview more community stakeholders
Time’s Up! • About your speaker: • Name: Michael Monroe • Company: Bromik Design & Build • Tel: (206) 795-8686 • Email: mmonro@uw.edu • Social Media: Call / Email • Quick bio: Michael is a Junior in the Community Environment & Planning Major and is also the Director of Operations for Bromik Design & Build in Kirkland. After he graduates Michael aims to help create an affordable housing nonprofit in Tacoma.