Development of a Dashboard for One-Way Delay Measurements Using perfSONAR
90 likes | 236 Vues
This project presents the creation of a prototype dashboard for monitoring one-way delay measurements across T1 sites, utilizing perfSONAR. The dashboard aggregates data from NTP-synchronized servers that measure one-way delays through UDP packets. It calculates key metrics such as minimum, median, and maximum delays, as well as packet loss and jitter. Deviations beyond established thresholds signal degraded or critical statuses. The solution is aimed at enhancing network performance monitoring and facilitating historical data analysis for network reliability.

Development of a Dashboard for One-Way Delay Measurements Using perfSONAR
E N D
Presentation Transcript
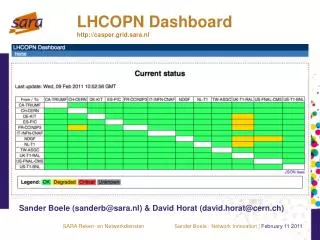
LHCOPN Dashboardhttp://casper.grid.sara.nl Sander Boele (sanderb@sara.nl) & David Horat (david.horat@cern.ch) SARA Reken- en Netwerkdiensten Sander Boele - Network Innovation | February 11 2011
Based on perfSONAR Hades • NTP synchronized server at each T1 site • 9 UDP packets to each other site measuring one-way delay • Statistics calculated by HADES on 9 OWD’s are summary stats: • Minimum delay • Median delay (if > 15% status becomes “degraded”) • Maximum delay • Min ipdv (Instantaneous Packet Delay Variation (jitter)) • Med ipdv • Max ipdv • Duplicates (# packets duplicated, never seen non zero) • Loss (#packets lost 0-8) (if > 2% status becomes critical) • Sync (yes or no) SARA Reken- en Netwerkdiensten Sander Boele - Network Innovation | February 11 2011
Dashboard prototype • Create a dashboard based on one-way delay measurements • 15% deviation from baseline is degraded • Packetloss is critical • Aggregate this data and also show historical data SARA Reken- en Netwerkdiensten Sander Boele - Network Innovation | February 11 2011
Architecture SARA Reken- en Netwerkdiensten Sander Boele - Network Innovation | February 11 2011
What other parameters? • Take NTP status of HADES into account (FNAL and BNL have no GPS) • Per site thresholds for degraded status • Compare traceroute, hopcount • More than one screen? Less intelligence, more data • BGP status? • GGUS connection? • Bandwidth monitoring? • Jitter? SARA Reken- en Netwerkdiensten Sander Boele - Network Innovation | February 11 2011
What others do Take a Nagios plugin that reads perfSONAR measurement data and applies logic SARA Reken- en Netwerkdiensten Sander Boele - Network Innovation | February 11 2011
What others do (2)at Atlas T2’s in the US SARA Reken- en Netwerkdiensten Sander Boele - Network Innovation | February 11 2011
What others do (3) SARA Reken- en Netwerkdiensten Sander Boele - Network Innovation | February 11 2011
What other parameters? SARA Reken- en Netwerkdiensten Sander Boele - Network Innovation | February 11 2011