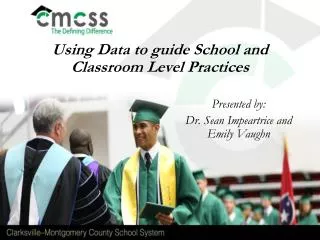
School Level Data Dive
School Level Data Dive. LEADING WITH DATA. School Level Data Dive Outcomes. Reflect on the power of leading with data to drive rigorous instruction for all students. Explore research on Howard County student outcomes that supports a pathway to college and career readiness.


School Level Data Dive
E N D
Presentation Transcript
School Level Data Dive LEADING WITH DATA
School Level Data Dive Outcomes Reflect on the power of leading with data to drive rigorous instruction for all students Explore research on Howard County student outcomes that supports a pathway to college and career readiness Deepen a skill set for analyzing data to drive rigorous instruction
Understanding Research-based Trends • Students who achieved a PSAT ≥ 145 in Grade 10 were 13 times more likely to be college ready and enroll in college immediately following high school • HCPSSstudents who participated in an advanced math course by Grade 8 (Algebra 1) are 3 times more likely than their peers who did not participate in Algebra 1 to be college ready
Making Connections: Math Progression Gr. 12 AP Calculus AB Gr. 11 Pre-Calculus Gr. 10 Algebra 2 Gr. 12 AP Statistics Gr. 9 Geometry Gr. 11 Algebra 2 Gr.8 Algebra 1 Gr. 10 Geometry Gr. 7 CC 8 Gr. 9 Algebra 1 Gr. 6 CC 7 Gr.8 CC 8 Gr. 5 Above (CC6) Gr. 7 CC 7 Gr. 6 CC 6 Gr. 5 CC 5
Making Connections Across levels, we are looking to build an academic profile of students who meet our Preliminary Performance Benchmarksand using this information to increase rigorfor all students.
Analyzing/Interpreting Data Beginning with School-Level Data
OPEN EXPLORATION:Orienting to the School-Level Data Description of Dataset • At least 3 years of data • Data reported by student group • Note the sheets/tabs at the bottom Dataset Codebook • School-Level Data Reference Guide
OPEN EXPLORATION:Orienting to the School-Level Data Activity 15 minutes (share at your tables) • Pick a tab/sheet. • What trends do you notice? • How are these trends changing? • Or not changing? • What surprised you? • What might you want to explore further? • What other data would be helpful?
Analyzing/Interpreting School-Level Data We know: HCPSSstudents who participated in an advanced math course by G8 (Algebra 1) are 3 times more likely than their peers who did not participate in Algebra 1 to be college ready. Question: How can understanding the academic profile of these students who meet this Benchmark help us increase access to rigor for all students starting in elementary school?
Analyzing/Interpreting School-Level Data Exercise 1: • Go to GT Participation tab • Filter for “All Students” in Student Group • Filter for Grade “5” Q1) What number and percentage of your Grade 5 students are participating in G/T Math? Q2) What is the trend across time?
Analyzing/Interpreting School-Level Data Exercise 2: • Clear the Student Group filter. • Filter for Year “2014” + Grade “5.” Look at your data by Student Group. Q3) What do you notice about each student group’s G/T Math participation in SY 2014? Q4) Select Year “2013.” Do you see similar trends across groups over time? Repeat for another year. Be prepared to share out
Analyzing/Interpreting Data Diving into Student-Level Data
From School- to Student-Level Data School-level data are your back story/context Student-level data are your actionable data
OPEN EXPLORATION:Orienting to the Student-Level Data Description of the Dataset • SY 2014 Grade 5 students • Current and prior years’ data • Each line represents one student Dataset Codebook • Student-Level Data Reference Guide Activity 5 minutes • Explore the variables • Use your filters, freeze top row
Analyzing/Interpreting Student-Level Data We know: • Based on research, Algebra 1 by G8 is linked to college readiness and college enrollment • Based on HCPSS math course progression, student needs to be in above-grade level or G/T Math by G5 to be able to take Algebra 1 by G8 Question: How can understanding the academic profile of the students who meet this PPB help us increase access to rigor for all students starting in elementary school?
Analyzing/Interpreting Student-Level Data Exercise 1: Filter for students who are in Above Grade Level Math (GRD5_MATH_INSTR_LEVEL_Q2: “Above”) • How many students do you have? • Describe their academic profile. • Performance-based factors (e.g., CogAT, MAP, MSA, SCAT, report card grades)
Analyzing/Interpreting Student-Level Data Exercise 2: Clear the “Above” filter; filter for “On” Grade Level (GRD5_MATH_INSTR_LEVEL_Q2: “On”) • Do you have students who have a similar academic profile that you have just identified but are not in “Above” Math?
Analyzing/Interpreting Student-Level Data Question: How do we support struggling students with different needs (e.g., On or Above Math but poor grades; Below Grade LevelMath)? Exercise 3: Students in AGL Math but poor grades Filter for students who are in Above-grade-level Math (GRD5_MATH_INSTR_LEVEL_Q2 “Above”) and Have a report card grade lower than B (REPORT_CARD_MATH_Q2 “B”) • How many students do you have? • Describe their academic profile.
Analyzing/Interpreting Student-Level Data Exercise 4: Performing well in current Math, not in AGL Math • Filter for students who were “Advanced” on MSA Math in Grade 4 (GRD4_MSA_MATH_LEVEL) and • Are being instructed “On” Grade Level Math (GRD5_MATH_INSTR_LEVEL_Q2) and • Add a filter for students who earned an “A” in Math in Quarter 2 (REPORT_CARD_MATH_Q2). Q1) What is their academic profile? Q2) What contributed to their current math instructional level placement?
Analyzing/Interpreting Student-Level Data Exercise 5: Below Grade Level Math Filter for students who are being instructed “Below” Grade Level Math (GRD5_MATH_INSTR_LEVEL_Q2) Q1) What is their academic profile like? Historical data? Q2) What might rigorous instruction look like for these students?
Connecting the Data to Rigorous Instruction TABLE TALK How will you use this data exercise, the Preliminary Performance Benchmarks, and the resources to support college readiness to lead with data?