Using USGS Watershed Data in the Classroom
120 likes | 142 Vues
This article explores the use of USGS watershed data in the classroom, including how to read data off a map, understand percentile rankings, and recognize the continuous collection and availability of scientific information. It also covers flood frequency analysis and flood stage inundation maps.

Using USGS Watershed Data in the Classroom
E N D
Presentation Transcript
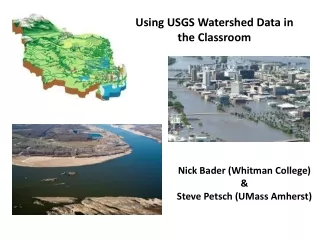
Using USGS Watershed Data in the Classroom Nick Bader (Whitman College) & Steve Petsch (UMass Amherst)
Using USGS Watershed Data in the Classroom http://waterdata.usgs.gov/nwis/rt
Using USGS Watershed Data in the Classroom http://waterwatch.usgs.gov/new/
Using USGS Watershed Data in the Classroom … “content” goals … “skill” goals … “attitude” goals http://waterdata.usgs.gov/nwis/rt Students using this website … A scientist using this website … … Gimme the data!
What do you see? (separating observations from interpretations)
content goals – recognize that stream discharge is spatially and temporally varying across the USA skill goals – read data off of a map, understand percentile rankings attitude goals – recognize that“they” is us, that much scientific information is continuously being collected and made publically available Drawing from your recent experiences, what might explain this? (separating observations from interpretations)
Rating curve Q (cfs) Gage height (feet)
Flood frequency analysis Peak Q (cfs) Recurrence interval (y)