Download
1 / 175
1.75k likes | 1.92k Vues
Community Wellbeing Survey. Help shape happy and healthy communities in Waterloo Region!. Why did we do a Wellbeing Survey?. D etailed information on citizens perceptions of quality of life. Inform planning and priority setting for partner organizations strategic planning process.

E N D
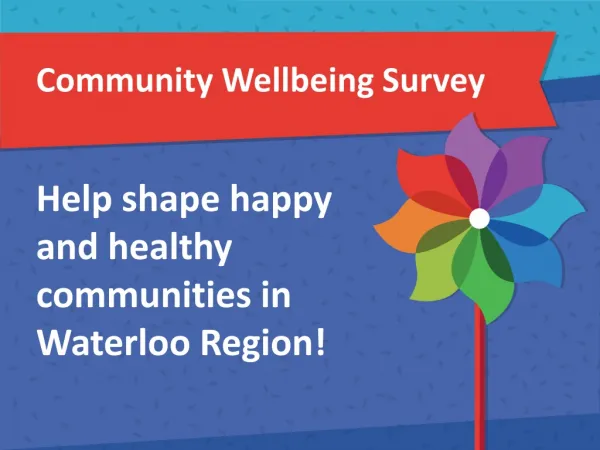
Community Wellbeing Survey Help shape happy and healthy communities in Waterloo Region!
Why did we do a Wellbeing Survey? • Detailed information on citizens perceptions of quality of life. • Inform planning and priority setting for partner organizations strategic planning process. • Provide "oil lights" on where we need to focus and/or do a deeper dive. • Identify which subgroups are doing less well. • Provide a baseline for measuring progress for Wellbeing Waterloo Region.
Collaboration • Funded by 16 organizations including all the area municipalities. • Will benefit many organizations. • Will benefit the collaborative work of Wellbeing Waterloo Region.
Wellbeing Survey Logistics • The survey was launched on April 16, 2018 and until August 18. • It took about 30 minutes to complete. • It was conducted online. • Paper copies were also available upon request. • The survey was voluntary and anonymous.
Promoted multiple ways • Did a random sample mail out to households • Promoted it online and through social media • Attended events • Went to community programs • Etc.
Next steps of survey • This is just the start! • Developed a prompt for discussion which is a summary of the highlights. • Survey sense making sessions to discuss the "stories" behind the data. • Disaggregating the data so specific information is not lost in the overall averages.
Think about… • What was surprising? • Where do we need to do a deeper dive on the data? • How do you think you will use the survey results? • Do you have any other questions or comments?
Bryan Smale Director Canadian Index of Wellbeing University of Waterloo
A Closer Look at CIW Community Wellbeing Survey Results for Waterloo Region Prepared for: Wellbeing Waterloo Region 10 May 2019
Wellbeing as a basic human right “People are much more than the goods and services they produce! Their health and quality of life come from the conditions of their daily living – the circumstances in which they are born, grow, live, work, and age.” The Honourable Monique Bégin Former CIW Advisory Board Co-Chair Former Canadian Commissioner WHO Commission on Social Determinants of Health
CIW Community Wellbeing Survey • Sample • Stratified (by municipality) random sample of households in the Region • Questionnaire • Behaviours and perceptions directly related to each of the CIW’s domains • Aspects of and overall wellbeing • Comprehensive demographics • Analysis • Technical report summarising all measures in the questionnaire • Targetted analyses on issues of local concern
Reliability of Sample and Results • Sample • Multipronged strategy to generate a representative sample, with targeted efforts to ensure lower income families, newcomers, and older adults were included • Estimated response rate of between 10% and 12% – above expectation for general population survey • Weighting of data by municipality, age, and sex ensures balanced representation of voices from across the Region • Results • Careful assessment of all respondents to ensure reliable and valid responses to majority of questions on survey • With over 5,000 viable respondents from across the region, the margin of error is ±1.4% (19 time out of 20) – better than most national polls
Wellbeing by Domain: Waterloo Region Overall Wellbeing in Region = 4.74
Wellbeing by Municipality: Waterloo Region Overall Wellbeing by Municipality
Wellbeing by Municipality: Community Vitality Community Vitality by Municipality
Wellbeing by Municipality: Democratic Engagement Democratic Engagement by Municipality
Wellbeing by Municipality: Education Education by Municipality
Wellbeing by Municipality: Environment Environment by Municipality
Wellbeing by Municipality: Healthy Populations Healthy Populations by Municipality
Wellbeing by Municipality: Leisure and Culture Leisure and Culture by Municipality
Wellbeing by Municipality: Living Standards Living Standards by Municipality
Wellbeing by Municipality: Time Use Time Use by Municipality
Characteristics of wellbeing in Waterloo Region What characterises residents with higher or lower wellbeing? Below average wellbeing Above average wellbeing Men Older Married (not common-law) Higher incomes More highly educated Longer time residing in Waterloo Region • Women • Younger • More often on their own • More often unemployed • Living with a disability • More spend over 30% of income on housing
Low Income Residents and Wellbeing Low income: Total household income before taxes from all sources was under $30,000 per year
Low Income Residents and Wellbeing Low income resident satisfaction with domains of wellbeing
Older Adults and Wellbeing Older adults: Residents aged 65 to 74 years and those 75 years and older
Older adults satisfaction with domains of wellbeing Older Adults and Wellbeing
Disabilities and Wellbeing Living with a disability or chronic illness: Residents who are living with a physical or mental disability or a chronic illness that limits their activity • 72.1% of residents living with a disability also said their physical or mental health limits their ability to fully participate in their community.
Satisfaction with domains of wellbeing for those residents living with a disability or chronic illness Disabilities and Wellbeing
Newcomers and Wellbeing Newcomers: Residents who have lived in Canada for 10 years or less
Newcomer satisfaction with domains of wellbeing Newcomers and Wellbeing
LIVING STANDARDS and Wellbeing How do residents with higher or lower wellbeing compare? Below average wellbeing Above average wellbeing More likely to have a regular weekday schedule Have better job fit Less likely to work long hours Have enough money to buy things they needed and wanted • Work at multiple jobs • Lower job security • More people could not pay their bills on time • More people could not pay their mortgage or rent on time • Work interferes with personal life
LIVING STANDARDS and Wellbeing by sex How do women and men compare on living standards? Women Men More likely to have a flexible work schedule More likely to work long hours Have enough money to buy things they needed and wanted Perceive more promotion potential with their job • Work at multiple jobs • More likely to have a regular weekday schedule • Work interferes with personal life
Financial Insecurity: Inability to pay bills on time INCOME AGE MUNICIPALITY LIVING ARRANGEMENT
Financial Insecurity: Inability to pay mortgage/rent INCOME AGE MUNICIPALITY LIVING ARRANGEMENT
Financial Insecurity: Inability to purchase food INCOME AGE MUNICIPALITY LIVING ARRANGEMENT