Download
1 / 35
350 likes | 451 Vues
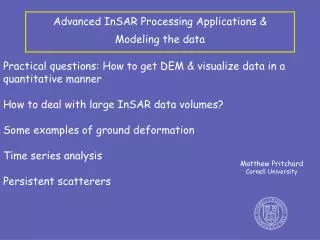
Explore an open-source data hub to improve integrated modeling applications for complex transportation decisions, connecting to AMS tools and supporting key initiatives. Access NEXTA software for data processing and visualization to facilitate model exchange across domains and resolutions.

E N D
An Open-Source Data Hub for Improving the Effectiveness of Integrated Modeling Applications Brandon Nevers (KAI) Xuesong Zhou, Jeff Taylor (Univ. of Utah) Prepared for 14th TRB Planning Applications Conference
Outline • Overview and Data Hub Concept • Development Goals • Connections to AMS Data Hub • Test Applications and Key Modeling Steps • Next Steps
Problem Statement and Need • Transportation decision making is complex; requires consideration of multiple levels of analysis or domains • Improved suite of tools is critical to support USDOT initiatives: • Connected Vehicles • Integrated Corridor Management • Active Transportation Demand Management • Many integrated modeling practices are still ad-hoc
Integrated Modeling Practices Current PracticeAd Hoc
Our Vision With AMS Data HubSystematic Current PracticeAd Hoc
FHWA Research Project • Project title: Effective Integration of Analysis and Modeling Simulation (AMS) Tools • April 2011 to January 2013 • Objectives: • Define a concept of operations • Allow for the effective integration of AMS tools across various domains and scale, • Perform multi-resolutionsimulation for multiple scenarios
Development Goal 2: Support Cross Resolution Modeling Mesoscopic simulation Regional planning model Microscopic simulation Height (Z-axis) represents zone-specific population Color range represents predicted accessibility
Development Goal 3: Facilitate Data Exchanges between Modeling/Simulation Software Packages Traffic assignment: Signal Optimization: Synchro Microsimulation: Vissim Google Maps Output
AMS Data Hub Software Prototype: NEXTA • Open Source: Available at Google Code: https://code.google.com/p/nexta/ • Windows based applications but with connections to on-line storage (Google Fusion Tables) • Start with GIS with multiple transportation layers • Network, demand, vehicle trajectory, Link MOE, …. • Focus on data processing and visualization
Connection 1: • Regional planning models • TransCAD • CUBE • VISUM • GIS shape files • Multiple demand formats • CSV, Matrix • Automatic identification of signal locations • Subarea cut utility • Export network to Google Maps
Network Data Importing • Import GIS node/link/zone shape files • Utilize Open-source Geospatial Data Abstraction Library (GDAL) library • Script for mapping planning data set to NEXTA data hub VISUM Open-Source Q-GIS
Connection 2: • Import DYNASMART/Dynust data set • Network • Signal Control • Vehicle trajectory • Trajectory-based statistics generation • Select link, path, subarea analysis • 95% percentile travel time • Planning index
Connection 3: • Import Aimsun vehicle trajectory file • Export synchro data format • Export VISSIM network data format (*.anm) • Extensions: • TRANSIMS • Open-source CORSIM
Connection to Synchro and QEM • Import Synchro data directly to NEXTA • Match nodes using two layers • Fetch signal data from Synchro layer for Dynamic Traffic Assignment • Future year study through QEM
Connection 4: • FREEVAL • HCM-based Quick Estimation Method (QEM) • Given turning volume, • Generate signal phasing and timing data
Signal Timing and Capacity Data Hub • NEXTA network data hub • HCM signal data hub • HCM highway capacity hub
Connection 5: • MOVES LITE • Simplified Emission Estimation Method • Safe prediction model • Given AADT, interchange type, link type • Predict crash rates • Different crash types
DTALite Large-scale Dynamic Traffic Assignment & Simulator Integrated MOVES Lite and DTALitePackages for Emission Analysis Emission Result Aggregation Microscopic Vehicle Trajectory Reconstruction Emission Estimates Project level Network level MOVES Lite Simplified Emission Estimation Method
Connection 6: • Inrix Sensor data • 15-min speed count • GPS data sets • Tomtom dataset from New York • NGSIM data set • Incident data (crash locations) • Google Transit Feed • Extension: • Dynamic OD demand calibration tools
Network Coding/Debugging/Calibration • Reduce editing and debugging efforts • Visualization and validation Purple band: observed volume vs. Darkblue band: simulated volume
Test Applications • Two test networks selected: • NW 185th Avenue in Portland, Oregon • I-10 in Tucson, Arizona • Primary objective: demonstrate linkages among AMS tools and field data • Model and field data already available to team • Familiar networks • Interested modeling agencies • Portland Metro • Pima Association of Governments
185th Avenue NWPortland, OR • Over 20 signalized intersections • Interchange ramp terminals at US-26 Data Sources • Counts / Volume • Historical count database • Signal Timing • Synchro • Travel Time/Speed • BluetoothTM AMS Tools • VISUM • DTALite & DynusT • Synchro • VISSIM
I-10 Freeway NetworkTucson, AZ • 5 miles of I-10 being reconstructed • 4 interchanges; 3 to be closed during reconstruction AMS Tools Data Sources • TRANSCAD • DTALite & DynusT • Synchro • VISSIM • 24-Hour Segment Counts • Intersection Turning Movement Counts • I-10 Mainline Speed
1. Network Import/Conversion • Highlighted Features • Supports flexible GIS network coding • Internal error checking (network coding) • Intersection control inference • Benefits • Time savings in quality control and network preparation efforts
2. Subarea Cut • Highlighted Features • Generate subarea OD demand matrix • Convert zone centroids and connectors to side streets • Benefits • Reduced physical effort in preparing subarea networks
3. Signal Timing Estimation • Highlighted Features • HCM-based Quick Estimation Method (QEM) • Evaluate Phasing, Timing, Movement Capacity, Left-turn treatment strategies, etc. • Data Exchange with Synchro and DTA packages • Benefits • Reduced effort in preparing intersection analysis
4. Calibrate O-D Demand Matrices • Highlighted Features • Calibrate subarea OD demand • Utilize time-dependent link counts • Integrated OD adjustment and simulation process • Benefits • Highly efficient assignment engine • Better path flow estimates for microsimulation
5. Data Management and Visualization • Highlighted Features • Google Fusion Tables (Cloud-based Data Storage) • Google Earth, 2D, 3D, 4D illustration • Flexibility/Interoperability through data format • Benefits • Enhanced visualization capabilities • Simplified data sharing between agencies, public
Estimated Time Saving from AMS Data Hub 80% Savings
Challenges • Network coding Different applications require different levels of details • Signal data representation • capacity; • turning movement and effective green time • dual ring signal timing • software/hardware in the loop • Software vendor buy-in • existing multi-resolution integration using their own proprietary format • community support (TRB/IEEE)
Next Steps • Receive comments and host webinar with invited user group • Continue model development and testing • Refine and expand connections with signal timing data • Linkage with Activity-Based Model • Expand number of AMS tool interfaces • Provide connection with real-time detector data • Identify and conduct pilot tests