Essential Tools for Team Discussion, Decision Making, and Idea Exploration
A variety of structured tools have been created to enhance team discussions and decision-making processes. These include the Seven Management and Planning Tools, such as Activity Network Diagrams and Affinity Diagrams, as well as techniques like Brainstorming, Consensus Building, and Fishbone Diagrams. This collection facilitates effective collaboration, encourages creativity, and fosters a deeper exploration of ideas within teams. These methodologies support organized and productive meetings, enabling teams to achieve their cognitive and affective goals efficiently.

Essential Tools for Team Discussion, Decision Making, and Idea Exploration
E N D
Presentation Transcript
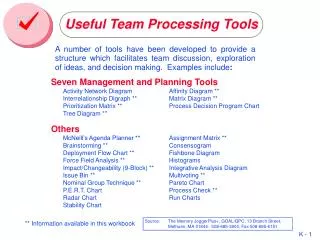
Useful Team Processing Tools A number of tools have been developed to provide a structure which facilitates team discussion, exploration of ideas, and decision making. Examples include: Seven Management and Planning Tools Activity Network DiagramAffinity Diagram ** Interrelationship Digraph ** Matrix Diagram ** Prioritization Matrix ** Process Decision Program Chart Tree Diagram ** Others McNeill’s Agenda Planner ** Assignment Matrix ** Brainstorming ** Consensogram Deployment Flow Chart ** Fishbone Diagram Force Field Analysis ** Histograms Impact/Changeability (9-Block) ** Integrative Analysis Diagram Issue Bin ** Multivoting ** Nominal Group Technique ** Pareto Chart P.E.R.T. Chart Process Check ** Radar Chart Run Charts Stability Chart Source: The Memory JoggerPlus+, GOAL/QPC, 13 Branch Street, Methuen, MA 01844. 508-685-3900, Fax 508-685-6151 ** Information available in this workbook
Time Block (minutes) Meeting Date From To Details Duration Meeting Location Topic Participants Team Leader Purpose Cognitive Goals Team Recorder Team Facilitator Affective Goals Team Time Keeper Discussion Tools or Activity Team Devil’s Advocate Required Reading or Preparation Visual/Audio /Other Aids/Equipment McNeill’s Agenda Planner
Assignment of Tasks (see the Matrix Diagram on page K-13 for the legend )
Post-its Workers unkind Don't like the people Pay is too low Lighting is poor Boss is good Brainstorming Hours are too long Air is Stuffy Can't live on wage Too Repetitive Room is not comfor. Work is not a challenge Managem't is great Affinity Header Cards Grouped Poor Compensation Poor Work Environment Poor Relationships Good Management Lack of Motivation Pay is too low Lighting is poor Don't like the people Managem't is great Work is not a challenge Hours are too long Room is not comfor. Workers unkind Boss is good Too Repetitive Can't live on wage Air is Stuffy Brainstorming and Affinity Processes Purpose: • To organize a large set of items into a smaller set of related items. Guidelines: • The rules of brainstorming are followed but each idea is written (in 7 words or less, including a noun and a verb) on a self-adhesive Post-it note or card. • Team members silently move the Post-it cards around to form closely-related idea groups. • If disagreement exists when grouping, make copies of the contested card and place in more than one group. • Label each group with a header card which clearly identifies and reflects the theme of the cards. • If there are single idea cards that don't fit well with the other ideas, have the team decide if they should be kept (they may be excellent ideas thought of only by one person).
Affinity Process Purpose To organize large sets of items (more than twenty items) into smaller sets of related items. Steps 1. The rules of brainstorming are followed but each idea is written (in seven words or less using a verb and a noun) on a self-adhesive Post-it note or card. 2. After all the ideas have been generated and entered on the Post-its, post all the Post-its on a wall or board. Discuss the Post-its to determine if there are any questions about what any of the Post-its say or mean. 3. Team members now silently move the Post-it cards around, grouping cards that have an affinity together. 4. If disagreement exists when grouping, make copies of the contested card and place in more than one group. 5. When the grouping has stopped, discuss each grouping to determine what it is that relates all the cards. Write a header card for each group that captures the theme and feeling of the cards. 6. If there are single idea cards that do not fit well with the other ideas, have the team decide if they should be kept.
Brainstorming PurposeTo generate a high volume of ideas in a non-analytical manner which permits the ideas of one individual to stimulate the ideas of the other individuals in the team. Steps 1. Define and write out a question (topic) for which you desire a large number of answers. 2. Silently generate and write down a list of ideas. When it seems most team members have stopped adding to their lists, share the lists and continue to generate ideas as they occur. 3. Record the information as given (i.e., do not paraphrase). 4. Do not criticize ideas or people. 5. Strive for fluency of ideas by building (piggybacking) on the given ideas. 6. Strive for a maximum number of ideas. 7. Strive for flexibility of ideas. Welcome wild ideas which can act as triggers to stimulate breakthroughs into new directions.
Steps in Creating a Deployment Flowchart 1. Identify steps for completing the process in the order they occur. 2. Use flowcharting symbols to diagram the steps in the process. 3. Connect the symbols with arrows indicating process flow. 4. Rework the flowchart by adding the people dimension. 5. Stretch meeting ovals to include all meeting participants 6. Draw rectangular symbols under person of primary responsibility; indicate input of others by use of circular symbols under their names connected with a line and arrow to the rectangular symbol. 7. Place decision diamond-shaped symbols under individual involved in the decision process.
meeting task multiple task document termination of process assistance or involvement standard process decision Symbols Used in Flowcharts
Promoting Preventing Force Field Analysis Purpose A force field analysis helps teams find out what is driving, slowing, or preventing change. The tool helps a team to work together, to find a starting point from which to take action, and to show both sides of the change issue. Steps 1. On a board or large piece of paper draw a vertical line down the middle and a horizontal line across the paper near the top. 2. Label the left column Promoting and the right column Preventing. 3. Brainstorm entries for the left hand column. 4. Brainstorm entries for the right hand column.
Impact Changeability Analysis • Purpose • This tool helps prioritize a set of options. • Steps • 1. Review the tables on the next page for possible meanings of: • Impact and Changeability • 2. Rank each option on impact and changeability using the following scales: • If the option were implemented (or problem eliminated) what impact would this have? • 1 = Little Impact • 2 = Some Impact • 3 = Considerable Impact • How difficult will it be to implement the option (or eliminate the problem)? • 1 = Difficult • 2 = Moderate Effort • 3 = Little or no Effort • 3. Use the chart on the next page to determine the relative priority of the options.
Impact Considerations • Effect on quality • Time savings • Material savingsMorale • Number of people who benefit Changeability # 7 # 3 # 1 Priority Little or No Effort = 3 # 2 # 8 # 4 Moderate Effort = 2 • Changeability Considerations • Resource requirements • Complexity of investigation • Time requiredAbility to measure outcomes • Number of decision making levels required # 6 # 5 # 9 Difficult = 1 Impact Considerable = 3 Impact Little Impact = 1 Some Impact = 2 Impact Changeability (cont.)
Interrelational Digraph Purpose To help understand the interrelationships which exist among the various aspects of a problem and highlight potential root causes and bottlenecks. Steps 1. Select an appropriate issue (e.g., one that has at least fifteen interrelated issues which need to be better defined). 2. Generate the list of issues (e.g., brainstorm, header cards from Affinity Process, bones from a Fishbone Diagram), placing each issue on a 3 x 5 Post-it. 3. Arrange the Post-its around the edge of a large circle, drawn either on a board or flip chart paper. 4. Number the Post-its, clockwise around the circle. 5. Starting with Post-it #1, ask the following question for each of the other Post-its: Does the issue listed on Post-it #1 influence or cause the issue listed on Post-it #n? 6. Whenever the answer to the question posed in 5 is yes draw an arrow from 1 to the Post-it which is influenced or caused by 1. 7. Repeat steps 5 & 6 using a different starting Post-it until all the Post-its have been used for starting the process. 8. Count the arrows leaving and entering the Post-its. Post-its which have a large number of arrows leading from the Post-it are potential Root Causes; while Post-its which have a large number of arrows leading to the Post-it are potential bottlenecks.
Purpose To help show relationships or requirements which exist among lists of items, requirements, criteria, resources, or people. Steps 1. Select an appropriate issue (e.g., one that has several lists of interrelated items). 2. Select the right type of matrix (e.g., an L matrix to relate two lists, a Y or T matrix to relate three lists, an X matrix to relate four lists). 3. Select an appropriate set of symbols and create a legend for the symbols, for example. P This person has primary responsibility The two items are strongly related This person has secondary responsibility S The two items are somewhat related This person needs to be kept informed The two items are not related 4. Fill in the matrix using the agreed upon symbols. 5. Interpret the matrix (interpretation will depend on why matrix was created, e.g., are all tasks assigned, is there one issue that is strongly related to a number of items, etc.). Matrix Diagram ( for an example, see the Assignment Matrix on page K-3 )
Modified Nominal Group Technique PurposeModified nominal group technique is a technique to help a team or group quickly reduce a large list of items to a smaller number of high priority items. The process elicits a high degree of team agreement and promotes team ownership. This tool is similar to nominal group technique but not quite as involved. Steps Step 1Count the number of items on the list and divide by three. This is the number of votes each person has. (Round fractions off to the lower number.) If the items number more than 60, do not go over a vote total of 20. Vote totals of more than 20 are hard to manage. Give each team member as many colored dots as she/he has votes. Step 2Have each person use his/her votes (colored dots) to select the items he/she wants to keep. While each person can vote for any item, it is a good idea to limit the number of votes any one item can receive from a single person to three. Note: the team can decide if they want to allow more or less multiple voting. Step 3List alternatives in their new prioritized order. Step 4Critically discuss the top alternatives in order to reach consensus. Eliminate those that are outside the control of the team.
1 = + 2 = 0 3 = & 4 = D 5= Modified Multi-Voting PurposeModified multi-voting is a technique to help a team or group quickly reduce a large list of items to a smaller number of high priority items. The process often results in a high degree of team agreement and it promotes team ownership. This tool is similar to the nominal group technique but it is less involved. Step 1Count the number of items on the list and divide by three. This is the number of votes each person has. (Round fractions off to the lower number.) If the items number more than 60, use a total of 20 votes. More than 20 votes are difficult to manage. Each person has one symbol (see above) for each vote. Step 2Each person should use their votes (or symbols) to select the items they want to keep. Each person can vote for any item. However, it is a good practice to limit the number of votes that any person can assign to one item to three; the team can decide if they want to increase or decrease this limit. Step 3List the alternatives in the new, prioritized order. Step 4Critically discuss the top alternatives in order to reach consensus. Eliminate those that are outside the control of the team.
Prioritization Matrix PurposeTo prioritize tasks, issues, alternatives, etc., to aid in selecting which tasks, issues, alternatives to pursue. Steps 1. Generate a set of criteria to be used in establishing the quality of the decision. 2. Construct an L matrix with options, etc. down the left and selection criteria across the top. 3. Each person prioritizes the criteria by distributing the value 1.0 among the criteria (i.e., sum of weights is 1.0). 4. Sum the weights from each person for each criterion; the sum becomes the team’s weight for the criterion. Enter these weights in the L matrix in brackets; each column will have the same number in each cell. 5. Examining one criterion at a time, rank (order) all the options, etc. with respect to the criterion using the modified nominal group technique. Enter the vote totals for each issue into the L matrix. 6. Find the product of the vote totals and weight for each issue and sum these products for each row. 7. The rows with the highest sums are the issues of highest priority. Be sure to discuss any row which has a low total but seems important enough to retain.
Criteria Prioritization Matrix PurposeTo improve any decision making process by rationally prioritizing or ranking criteria ( which will then be used to prioritize the tasks, issues, alternatives, etc. ). Steps 1. Generate a set of criteria to be used in making a ‘quality‘ decision. 2. Construct an L matrix with criteria down the left side and criteria across the top. 3. Compare the criteria in EACH row with the criteria in EACH of the columns ( i.e., a 'pairwise' comparison ). 4. The Team should discuss each comparison and reach consensus on the relative importance of the two criteria. Avoid voting if at all possible. 5. Enter the appropriate word (e.g., =Same), or value, for the comparison in the appropriate ROW and COLUMN ( e.g., R1 / C2 ). 6. Enter the RECIPROCAL of the word (e.g., =1/Same), or value, entered in 4. above in the corresponding COLUMN and ROW ( e.g., R2 / C1). 7. Sum the numerical values in each row for each criterion. The sum becomes the team’s weight for the criterion. 8. The rows with the highest sums are the criteria of highest priority. Be sure to discuss any row which has a low total but seems to be more important than the total indicates. Always review the numerical values to determine if they ‘make sense’ to the team!
Task Prioritization Matrix PurposeTo improve any decision making process by rationally prioritizing, or ranking, tasks, issues, alternatives, etc. using weighted criteria. Steps 1. Generate a set of criteria to be used in making a quality decision. Determine the weight for each criterion using the Full Consensus Criteria Matrix process. 2. Construct an L matrix with tasks, etc. down the left side and the selection criteria across the top. 3. Enter the ‘full analytical criteria’ weights in the L matrix in the row below the criteria. 5. For EACH criteria (or column), rank order all the tasks, etc. with respect to that criteria ( e.g., using the modified nominal group technique). Enter the rank, or vote totals, for each task, etc. into the L matrix in the appropriate column and row. N.B. The higher the rank, or the larger the number, the more important the task. 6. Find the product of the individual rank, or vote totals, and criterion weight for each task (or row), etc. and sum these products for each row. 7. The rows with the highest sums are the issues of highest priority. Be sure to discuss any row which has a low total but seems important enough to retain. Always review the numerical values to determine if they ‘make sense’ to the team!
Process Check • Monitoring of processes, especially processes which you own or are a part of, is necessary if improvement is desired. • A process check is a formalized way to do this monitoring and should be used at the end of all process related activities. • There are many different ways to conduct a process check. • A process check must focus on the process. • Failure of a process does not infer any judgment about the quality of the team members.
Tree Diagrams, Conventions • Each item placed on the tree has, for example, a direct cause-and-effect relationship with the item to the left of it, i.e., the second level of detail directly causes the first level of detail to happen. • Each level of detail, for example, answers the question, ‘How will this be accomplished’? • As you go from left to right, the level of detail gets finer. • If the items at the lowest level of detail are ‘recognizable’ modules that can be implemented (e.g., can be assigned to someone else to accomplish), the tree is complete. • Ask the following questions, for example: • Going from right to left: ‘Will these actions really accomplish the next higher level of the task?’ • Going from left to right: ‘If I want to accomplish this, do I really need to do all of these lower levels of detail?’
Thermal Fluids Statics Mechanics Dynamics Engineering Sciences Deformable Solids Electrical Sciences Materials Science Material Balances Tree Diagrams, An Example
Frames Method of Sections Trusses Method of Members Statics Method of Joints Other Structures Attachments, Connections Ropes, Pulleys Tree Diagrams, An Example (cont.)


![Useful tools for [tech] startups](https://cdn2.slideserve.com/5187216/slide1-dt.jpg)