Download
1 / 23
240 likes | 515 Vues
Eukaryotic linkage, part 2. Three-point mapping to determine genetic maps Multiple cross-overs How to: analyzing the 3 pt testcross Mapping the results The accuracy of mapping Mitotic recombination and Sister Chromatid Exhanges Genetic mapping in haploid eukaryotes Ordered tetrad analysis

E N D
Eukaryotic linkage, part 2 • Three-point mapping to determine genetic maps • Multiple cross-overs • How to: analyzing the 3 pt testcross • Mapping the results • The accuracy of mapping • Mitotic recombination and Sister Chromatid Exhanges • Genetic mapping in haploid eukaryotes • Ordered tetrad analysis • Unordered tetrad analysis
RI RII • DCOs (double crossovers) double exchanges of genetic material in two regions (RI & RII) • Probability of a single crossover occurring between two loci is directly related to the distance separating the loci – in the case of a DCO, two separate and independent crossovers must occur simultaneously.
three-point testcross for mapping genes • Cross two true-breeding strains that differ with regard to three alleles to obtain F1 individuals that are heterozygous for all three alleles: y+y, w+w, ec+ec • Perform a testcross by mating the F1 female to males that are homozygous recessive for all three alleles • Results in 8 phenotypic classes (23) FI female: (heterozygous for 3 genes) y+ w+ ec+ y+ w+ ec+ y w ec y w ec her possible gametes: y w ec y+ w+ ec+y w ec+ y w+ ec y w+ ec+ y+ w ec y+ w+ ec y+ w ec+
How to: analyzing the 3 pt testcross • Collect data from the F2 generation. • Parental types (usually the two highest #’s) • Non-Parentals (recombinants) • Double Crossovers (two lowest #’s) • Single Crossovers (two are RI, two are RII) • Determine the gene order based upon the DCOs • Calculate the RF for each region to determine the map distance between genes (#recombinants/total x 100)
P: v+v+, cvcv, ctct x vv, cv+cv+, ct+ct+ Testcross: v+v, cv+cv, ct+ct x vv, cvcv, ctct
Parental input Possible output Only the firstpossibility is compatible with the data. t
Example: bb prpr vgvg x b+b+ pr+pr+ vg+vg+F1: b+b pr+pr vg+vg testcross: F1 x bbprprvgvg Distance between b & pr = 61/1005 x 100 = 6.1mu Distance between pr & vg = 124/1005 x 100 = 12.3mu
Mapping the results: The eye color gene must be in the middle. This order of genes is confirmed by the pattern of traits found in the double crossovers. vg pr b 12.3 6.1 vg+ pr+ b+ vg pr b vg+ pr b+ vg pr+ b Double crossover data
D. The accuracy of mapping: Interference • Interference = When a crossover in one region affects the likelihood of there being a crossover in an adjacent region • Expected frequency of DCOs much lower than that of either SCO class of gametes alone! • DCOs rare between segments that are very short • If crossovers in the 2 regions are independent, then: • frequency of double recombinants = product of the recombinant frequencies in the adjacent regions • Expected DCOs = 0.061 x 0.123 = 0.0075 x 1,005 = 7.5 • Coefficient of coincidence (c.o.c) • Observed/expected double recombinants – 1 • 3/7.5 = 0.4 • I = 1-c.o.c • 1 – 0.4 = 0.6 or 60%, positive interference • 60% of the expected number of DCO’s did not occur
Step by step summary: • Calculate the RF for each pair of genes • Draw the linkage map • Determine the double recombinants • Calculate the Frequency & # of double recombinants expected if there is no interference • Calculate Interference
Problem: Vermilion eyes are recessive to normal, miniature wings are recessive to long wings, and sable body is recessive to gray body. A cross was made between a heterozygous female for all three genes and a homozygous recessive male. • Data: 1,320 vermilion eyes, miniature wings, sable body • 1,346 red eyes, long wings, gray body • 102 vermilion eyes, miniature wings, gray body • 90 red eyes, long wings, sable body • 42 vermilion eyes, long wings, gray body • 48 red eyes, miniature wings, sable body • 2 vermilion eyes, long wings, sable body • 1 red eyes, miniature wings, gray body • Determine the gene order & calculate the map distance between the three genes • Calculate interference
E. Mitotic recombination and Sister Chromatid Exhanges • Mitotic recombination = crossing over that occurs during mitosis (it does happen, in often in Drosophila & fungi – also in humans & mice) • It is likely that the recombinational repair of DNA lesions occurs preferentially by sister chromatid exchanges that have no genetic consequences • Those between non-sister chromatids producemutant “patches” in female flies = twin spot • SCE’s don’t produce new allelic combinations, but may be involved in repairing DNA lesions
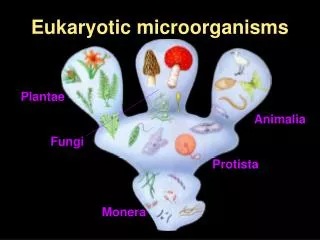
II. Genetic mapping in haploid eukaryotes • Fungi – haploid (n) multicellular organisms that can reproduce asexually to create a diploid zygote • Diploid zygote proceeds through meiosis to produce four haploid spores = ascospores
Group of four spores is known as a tetrad • In some species meiosis is followed by mitosis to produce eight cells – known as an octad. • Ascus = sac that contains the tetrad/octad • Can do an ordered tetrad analysis because the 8 cells reflect the sequence of formation
what’s the “fun” in fungi? • They are haploid • They produce large #’s of progeny • They have short life cycles • Can make direct observations on the behavior of genes during meiosis, can examine cross-overs, can map centromeres Chlamydomonas Neurospora
A. Ordered tetrad analysis: Linear tetrad analysis can be used to map distance between a gene and the centromere. 1). FDS PATTERN: Octad contains linear arrangement of 4 haploid cells that contain A & 4 haploid cells that contain a (4:4 pattern)
2) SDS PATTERN: • If a crossover occurs between the gene & centromere, the ordered octad will deviate from the 4:4 pattern • 2:2:2:2 • 2:4:2 A and a alleles do not segregate until the 2nd meitotic division is complete!
Calculating map distance w/ ordered tetrads • % of SDS or M2 asci can be used to calculate the map distance between the centromere & the gene of interest • Map distance = (1/2) (# of SDS asci) x 100 total # asci
B.Unordered tetrad analysis can be used to map genes in dihybrid crosses, Spores are randomly arranged ab Haploid cell x Haploid cell AB Aa Bb Diploid zygote meiosis AB AB ab ab AB Ab aB ab Ab Ab aB aB Parental ditype Tetratype Nonparental ditype
When two genes are located on the same chromosome: Map distance = (1/2) ([TT] + 3[NPD]) + 4 [NPD] / total x 100 If the # of parentals = nonparentals, the two are unlinked If there are TT’s, CO’s have occurred, if there are NPDs’ then DCO’s occurred.
The following spore arrangements were obtained from tetrads in a cross between Neurospora strain com val (c v) and a wild type strain (+ +). Only 1 member of each pair of spores is shown. Spore pairAscus composition 1-2 cv c+ cv +v cv 3-4 cv c+ c+ c+ +v 5-6 ++ +v +v cv c+ 7-8 +++v++++++ Number: 35 36 20 1 9 What can you conclude about linkage? 35 PD 36 NPD 30 TT PD = NPD, genes not linked