Download
1 / 1
10 likes | 114 Vues
This study investigates ethnic differences in stroke outcomes between Mexican Americans (MAs) and non-Hispanic whites (NHWs) through the BASIC project conducted in Corpus Christi, TX. We assessed the impact of factors such as optimism, fatalism, spirituality, and depressive symptoms on stroke recurrence and mortality. While MAs exhibited higher recurrence rates and lower mortality, these psychological factors did not explain the disparities observed. However, the influence of depression and optimism on ethnicity-stroke outcome relationships warrants further exploration.

E N D
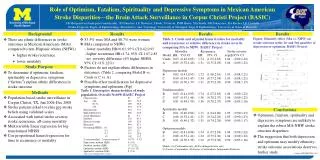
Role of Optimism, Fatalism, Spirituality and Depressive Symptoms in Mexican American Stroke Disparities—the Brain Attack Surveillance in Corpus Christi Project (BASIC) LB Morgenstern (lmorgens@umich.edu), BN Sánchez, LE Skolarus, J Baek, N Garcia, JMH Risser, MA Smith, DB Zahuranec, KA Kerber, LD Lisabeth Stroke Program, Depts. of Epidemiology, Biostatistics, and Neurology University of Michigan; Dept of Epidemiology University of Texas at Houston Background Results Results Results • There are ethnic differences in stroke outcomes in Mexican Americans (MAs) compared to non-Hispanic whites (NHWs) • higher stroke recurrence • lower mortality • To determine if optimism, fatalism, spirituality or depressive symptoms (“factors”) explain ethnic differences in stroke outcome • Population-based stroke surveillance in Corpus Christi, TX, Jun 2004-Dec 2008 • Stroke patients asked to relate pre-stroke beliefs using validated scales • Associated with initial stroke severity, stroke recurrence, all-cause mortality • Multivariable linear regression for log-transformed NIHSS • Cox proportional hazard regression for time to recurrence or mortality • 53.5% were MA and 48.7% were women • MAs compared to NHWs • - lower mortality HR=0.63, 95% CI:0.42,0.95 • - higher recurrence HR=1.74, 95% CI:1.07,2.83 • - no severity difference (4% higher NIHSS, 95% CI:-11%,22%) • Factors do not explain ethnic differences in outcomes (Table 2, comparing Model B vs. Crude or C vs. A) • Possible effect modification for depressive symptoms and optimism (Fig) Table 2. Crude and adjusted hazard ratios for mortality and recurrence or relative difference in stroke severity comparing MA to NHW. BASIC Project Mortality Recurrence Stroke severity Model HR 95% CI HR 95% CI exp(β) 95% CI Crude 0.63 (0.42,0.95) 1.74 (1.07,2.83) 1.04 (0.89,1.22) A 0.85 (0.52,1.40) 1.31 (0.75,2.29) 1.04 (0.89,1.22) Depression models B 0.62 (0.41,0.93) 1.72 (1.06,2.81) 1.03 (0.88,1.21) C 0.89 (0.54,1.47) 1.34 (0.77,2.34) 1.03 (0.88,1.21) D 0.83 (0.50,1.37) 1.31 (0.75,2.29) 0.99 (0.84,1.15) Fatalism models B 0.62 (0.41,0.93) 1.74 (1.07,2.83) 1.04 (0.89,1.22) C 0.87 (0.53,1.44) 1.36 (0.78,2.37) 1.04 (0.89,1.22) D 0.81 (0.49,1.33) 1.36 (0.78,2.37) 0.99 (0.85,1.16) Spirituality models B 0.61 (0.40,0.92) 1.71 (1.04,2.80) 1.05 (0.90,1.23) C 0.86 (0.52,1.41) 1.31 (0.74,2.29) 1.05 (0.90,1.23) D 0.81 (0.49,1.32) 1.31 (0.74,2.29) 0.99 (0.85,1.17) Optimism models B 0.62 (0.41,0.94) 1.74 (1.07,2.83) 1.04 (0.89,1.22) C 0.86 (0.53,1.41) 1.32 (0.75,2.30) 1.04 (0.89,1.22) D 0.81 (0.50,1.32) 1.32 (0.75,2.30) 0.99 (0.85,1.16) Models: (A) Confounders only; (B) Psychological factor only; (C) Factor + Confounders; (D) Factor + Confounders+ Independent Predictors. Figure: Ethnicity effect (MA vs. NHW) on stroke outcome at the 1st and 3rd quartiles of depression or optimism. BASIC Project Study Purpose • Table 1. Descriptive characteristics of study population. Overall (N=699) BASIC Project Methods Characteristic N %* Age <60 227 33.9 60-74 189 28.3 ≥75 253 37.8 Hypertension 516 77.1 High Cholesterol 286 42.8 Atrial fibrillation 61 9.1 Diabetes 276 41.3 History of stroke 149 22.3 Education 449 67.1 Presenting NIHSS, 0-1 218 32.6 2-3 157 23. 4-7 191 28.6 >7 102 15.2 2-year mortality§, 2-year recurrence§10.7%, 9.1% Depression, median (IQR) 4 (1,8) Fatalism, median (IQR) 17 (13,21) Optimism, median (IQR) 19 (15, 22) Spirituality, median (IQR) 8 (7,8) *Unless noted, §Kaplan-Meier estimates Conclusions • Optimism, fatalism, spirituality and depressive symptoms are unlikely to explain the robust MA-NHW stroke outcome disparities. • The suggestion that both depression and optimism may modify ethnicity-stroke outcome associations deserves further study. • Funding: NIH/NINDS R0138916


