Download
1 / 23
230 likes | 241 Vues
Using IR Emission to Trace H 2 in Galaxies. CO emission from the SMC (Mizuno+ 01). Adam Leroy NRAO Charlottesville Hubble Fellow Alberto Bolatto Karl Gordon Erik Rosolowsky Snezana Stanimirovic Frank Israel Caroline Bot Andreas Schruba Karin Sandstrom Norikazu Mizuno Evidge Corbelli

E N D
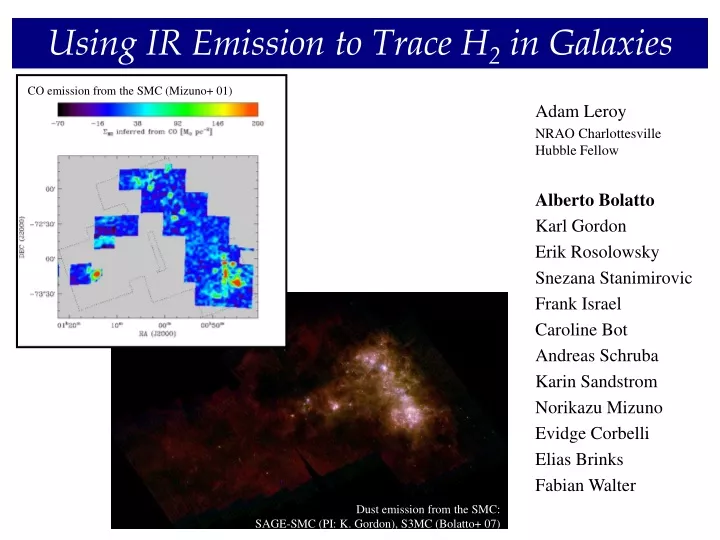
Using IR Emission to Trace H2 in Galaxies CO emission from the SMC (Mizuno+ 01) Adam Leroy NRAO Charlottesville Hubble Fellow Alberto Bolatto Karl Gordon Erik Rosolowsky Snezana Stanimirovic Frank Israel Caroline Bot Andreas Schruba Karin Sandstrom Norikazu Mizuno Evidge Corbelli Elias Brinks Fabian Walter Dust emission from the SMC: SAGE-SMC (PI: K. Gordon), S3MC (Bolatto+ 07)
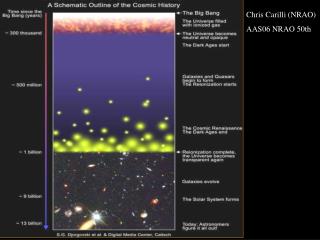
Ways to Get at H2 (in Other Galaxies)… The H2 that makes up most of the mass in GMCs is practically invisible. Indirect tracers have to be used, which may have their own environmental biases. H2 UV absorption studies: great! But requires background source, probe pencil beam. Rotational line emission (IRS), sensitive only to gas down to T~100K (most H2 much colder). Cosmic ray hits nucleus, produces ray… modeled to yield total nuclei column density. Major resolution and sensitivity challenge beyond Milky Way, modeling complex… rays Probes total gas column modulo dust-to-gas ratio. Absorption tough because of lack of clear background screen. Emission limited by finite resolution of IR telescopes. Dust Next most common molecule after H2. Standard tracer of H2 in high-mass galaxies. At low metallicities C and O less abundant and dust shielding weak. CO suppressed? Comes with velocity information - dynamics offer another way to trace mass. CO
Local Group Dwarfs (very low CO / SFR) Why We Think CO May Break in Low Mass Galaxies… CO is faint, but when it can be measured (roughly the Local Group) these galaxies have low CO-to-SFR, CO-to-HI and CO-to-starlight ratios. Is this a real effect on the H2 or a breakdown in our tracer? Dots: measurements from various local galaxies. Dots: relatively massive star-forming galaxies. CO per B-band Luminosity SFR per unit area Stellar Luminosity [Magnitudes] CO per unit area
The CO-to-H2 Conversion Factor… Is the amount of H2 inferred from various independent tracers consistent? e.g., CO brightness, dynamics, and dust emission… • Ratio of H2 column density to CO intensity. • Certainly a function of scale studied. • In this talk: shorthand for “how much H2 is there?” • Milky Way value ~1.5 - 3.0 1020 cm-2 (K km s-1)-1 • Recast as , equivalent parameter in mass units. XCO
Using CO Dynamical Masses to Calibrate XCO… Early (often interferometer) studies used dynamical masses and found a moderate increase in the amount of H2 per CO as metallicity decreases. Arimoto+ ‘96 Wilson ‘95 CO-to-H2 Conversion Factor CO-to-H2 Conversion Factor Metallicity Metallicity GMCs seen in CO in IC 10
Using CO Dynamical Masses to Calibrate XCO… In subsequent studies at higher resolution and sensitivity this effect has diminished. Points are galaxies, error bars show full range of XCO Linear XCO from Virial Mass (units of Milky Way) SMC Milky Way Milky Way range Metallicity [12+log O/H] See also: Walter et al. (2001, 2003) in NGC3077, 4214 and Israel et al. (2003) in Magellanic Clouds Bolatto et al. (2008)
Using Infrared Emission Instead of CO… Dust emission offers another independent check on the H2 distribution. Observed CO • Dust traces the total gas (HI + H2) column. • Better than CO? at least different biases… • In the Galaxy, matches rays and CO well. Predicted from IRAS Dust Emission Comparison in Profile (pretty good match!) Dame+ 01 (see also Bloemen ‘90) H2 = (dust× DGR-1)- HI Estimate dust surface density from IR (need at least two bands to make a temperature estimate). Measure the dust-to-gasratio from the ratio of dust to atomic gas away from the molecular line emission but near enough to calibrate out galactic variations. Subtract the already known distribution of atomic gas.
Using Infrared Emission Instead of CO… Suggests strong XCO variations in dwarfs. Israel (1997) • IRAS towards many galaxies • temperature correction based on 60/100 • very steep dependence, XCO Z-2.7 CO-to-H2 Conversion Factor IR-to-HI map of the SMC Metallicity
Using Infrared Emission Instead of CO in the SMC… Higher resolution application to the SMC finds large XCO with H2 in roughly the same spot as the CO peaks but more extended. 45 pc resolution to match NANTEN CO H2 peaks match CO, but H2 more extended Total H2 mass 3 ×10⁷ Msun much more than implied by CO.H2 ~ 10% of the HI mass. Roughly in line with SFR and stellar content. Dust Leroy et al. (2007) See also: Rubio+ 04, Bot+ 07; LMC study by Bernard+ 08
Using Infrared Emission Instead of CO in the SMC… Mizuno et al. (2001) - NANTEN CO map of the SMC 45 pc resolution to match NANTEN CO H2 peaks match CO, but H2 more extended Total H2 mass 3 ×10⁷ Msun much more than implied by CO.H2 ~ 10% of the HI mass. Roughly in line with SFR and stellar content. CO Leroy et al. (2007)
Z H2 C+ CO Clumps at decreasing (left to right) metallicity… Why the Discrepancy Between Dust and CO Dynamics? The discrepancy between CO, dynamics, and IR may be largely a function of PDR structure, driven by dust shielding… As metallicity and dust-to-gas ratios decrease…… Av~1 mag moves deeper into a given clump. CO disappears when Av<2 mag through a clump… … but H2 exists to much lower extinctions CO kinematics pick up only inner (CO-bright) part of cloud S. Glover Poster Maloney & Black (1988), Lequeux et al. (1994), Bolatto et al. (1999), Röllig et al. (2006)
Infrared Emission and CO at High Resolution… A similar approach at high (10 pc) resolution in the SMC Wing appears to work… CO H2 from Dust 10 parsec resolution (previous map ~45 pc) Leroy et al. (2009)
Infrared Emission and CO at High Resolution… On 10 pc scales, the data appear consistent with dust shielding playing a key role in whether or not CO is present… CO Intensity Line-of-Sight Extinction (Estimated From IR Emission) Leroy et al. (2009)
This Experiment… 1 Measure HI, CO, and IR (24+70+160) over matched lines sight. Try to focus on areas where HI ~ H2. 2 Estimate the dust surface density (or optical depth) from FIR emission. Need at least two bands (here 70, 160) to make a temperature estimate. 3 Vary XCO and measure scatter about the bet-fit dust-to-gas ratio. Look for XCO that minimizes scatter or maximizes dust-gas correlation.
The Two Nearest Spirals… M31 HI: WSRT Brinks & Shane ‘84 IR: Spitzer Gordon et al. ‘05 CO: IRAM 30m Nieten et al. ‘06 M33 HI: WSRT Deul & van der Hulst ‘87 IR: Spitzer K. Gordon see Verley+ ‘07, Tabetabei+ ‘07 CO: FCRAO + BIMA Rosolowsky+ ‘07 Heyer, Corbelli et al. ‘04
The Two Nearest Star-Forming Dwarfs… LMC HI: ATCA Kim et al. ‘98 IR: Spitzer SAGE Meixner et al. ‘06 CO: NANTEN Fukui et al. ‘99 SMC HI: ATCA + Parkes Stanimirovic et al. ‘99, ‘04 CO: NANTEN Mizuno et al. ‘01 IR: Spitzer S3MC and SAGE-SMC Bolatto et al. ‘07, Gordon et al. ‘09, ‘10
Step 1. Grab regions where HI and H2 both contribute to the ISM… M31 M33 LMC SMC CO Maps (roughly) Region Considered
Step 2: Minimize Scatter in (XCO CO + HI) vs. Dust • Error bars: bootstrapping • Not independent • Bar: 1 range for minimum
Step 3: Compare Results Among Galaxies (XCO) • Each point a different methodology… • Colors: how to solve • Correlation • Rank correlation • Scatter • Median Abs. Dev. • Error bars: Bootstrapping • Point Shape: dust map • Draine & Li 2007 • Modified BB (=1.5) • 70 m = 50% VSG • 160 m intensity Draine et al. (2007) Using Dust in SINGS CO-to-H2 Conversion Factor Milky Way Galaxy (Decreasing Metallicity)
Conclusions • IR emission from dust can be used as an ISM tracer. • Gives a way to estimate otherwise invisible H2. • Significant discrepancies from interferometric CO dynamics. • Dust shielding key? CO only at core of clouds? • Local Group XCO(IR) ~ constant in M31, M33, LMC; SMC high Follow-Up How does dust-to-gas ratio and emissivity of H2 relate to HI? How does CO as a function of AV vary with location and U? Herschel: Expand Local Group experiment to many galaxies.
Sanity Check on Dust-to-Gas Ratio Draine & Li (2007) models May be a bit biased low? (i.e., too much dust) Trend about right (a bit steep?) Super-linear agrees with Munoz-Mateos 2009 Gas-to-Dust Ratio (Draine & Li 2007) Milky Way
AV Estimates in the Magellanic Clouds from FIR ~10 parsec resolution
The 160 Micron Band and Temperature Emission at 160 per unit optical depth Temperature [K]