Download
1 / 37
370 likes | 384 Vues
The QuarkNet team at the University of Illinois at Chicago is developing a large array of cosmic ray detectors to study the passage of charged particles and measure the impact of muons from high energy showers. The project aims to understand the characteristics of cosmic rays and improve data collection and analysis techniques.

E N D
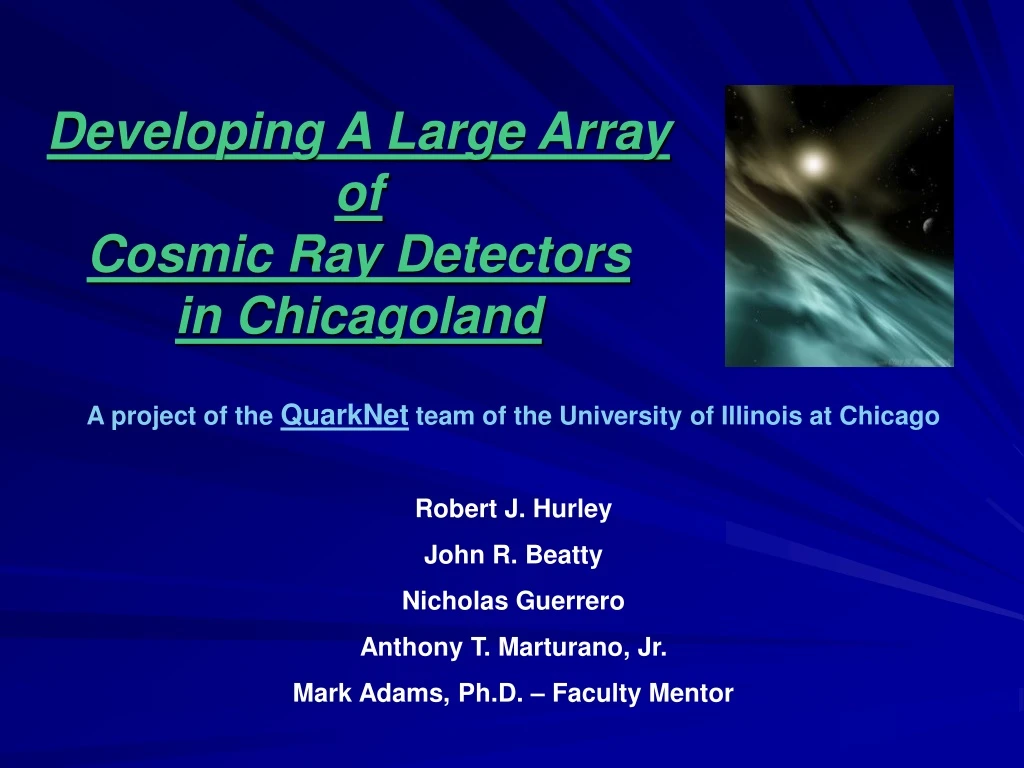
Developing A Large Array of Cosmic Ray Detectors in Chicagoland A project of the QuarkNet team of the University of Illinois at Chicago Robert J. Hurley John R. Beatty Nicholas Guerrero Anthony T. Marturano, Jr. Mark Adams, Ph.D. – Faculty Mentor
The QuarkNet team of the University of Illinois at Chicago: Chicago Public Schools: Elgin Community High Schools: Clayton Smith Jacqueline Barge Lynn Frosig Jozefa Kondratko Waclaw Kondratko Charlotte Wood-Harrington Proviso Township High Schools: John Beatty Nicholas Guerrero Robert Hurley Harvey Nystrom Bozena Suwary Maine Township High Schools: Katherine Seguino Phil Sumida Rich Township High Schools: Anthony Marturano Faculty Advisor: Mark Adams, Ph.D.
A Quick Chronology: • In 2001, QuarkNet/UIC’s high school teachers began constructing portable, cosmic ray detectors that could be used in classrooms to gather data on the passage of charged particles. • In 2002, those detectors were also used to demonstrate Einstein's theory of time dilation by comparing the muon flux at ground level with that on the roof of the Sears Tower in Chicago.
A Cosmic Ray Telescope • In working with the detectors, the initial assumption was that cosmic rays shower vertically. • Over the summer of 2002, the QuarkNet/UIC team built an angular distribution table to test that hypothesis.
Angular Distribution Table During cosmic ray angular distribution measurement with two detectors, we learned that even the horizontal rate was not zero. When a third detector was added to the horizontal table, there were rarely three simultaneous muon hits. This suggested that different muons from the same shower were striking two detectors and not the third. Therefore, these must be correlated muons, i.e. HEP showers that create multiple muons. Using this rotating table with 2 detectors, the direction of the muon emission can be defined.
Shower Cosmic ray interacts in atmosphere,producing many particles.Muons reach surface.Counter timing reconstructs source location. m m Counter 1 m Counter 2 Extra path leads to t2 > t1
Summer 2003 ~ • Constructed six mini-arrays, each containing 3 or 4 detectors, • Each mini-array independently monitors the frequency of nearly simultaneous passage of charged particles. (At least 2 detectors in each mini-array must record an event within a 300 ns window for data to register.) • The mini-arrays, with GPS time-stamping, are currently distributed across two of UIC’s buildings (SEL & SES).
Board layout Serial port (output to PC) GPS input Reset switch 5V-DC input Time-to-digital converter Programmable logic Trigger output Inputs for 4 counter signals Microcontroller
Typical Mini-Array HV cow cw base DAQII 5V GPS on roof PC
A Mini Array of Cosmic Ray Detectors Multiple Muons Single Muons
A,E F D C B Mini-Array locations at UIC (A-F) 180 m 200 m
red dots indicate hit scintillatorstimes given in ns 0 6 A+E F 6 SEL D 28 Simulated event display 34 60 What direction did this event come from? 60 65 C B SES
Research Goals ~ • Observe of the size of the ground area impacted by muons from high energy showers. • Develop air shower source pointing algorithms from counter timing data. • Calculate the location at which a proton impacted the atmosphere and caused the muon shower.
The Summer Crunch (July 2, 7, 14-17, 21, 25, 30 & 31) • Teachers got all six mini-arrays working! • Calibrated all detectors and mini-arrays in SEL 2069 • Moved mini-arrays to remote locations • QuarkNet/Notre Dame can post our data to internet • CHICAGO POWER OUTAGE • Blamed on QuarkNet/UIC cabling • Killed array operation within 30 minutes • Several more days - got it all working together again • some remaining GPS problems, 3 PCs disk drives failed, ethernet not quite prime time, no automatic data collection
DAQ I operation DAQ II operation • Large Array • Multiple muons - air shower • Energy - 100 GeV • Trigger 2 in horizontal array • Measure rates and pattern - correlate with other arrays • Output many lines leading and trailing edges of all pulses • Time Dilation; Muon Lifetime • Single muon (plus decay) • Energy – 1 GeV • Trigger 3-fold vertical array • Measure rates and decay time • Output one line Counter 1 Counter 2 m m Counter 3 m m Counter 2 Counter 1 Counter 3
Future Plans • Understand DAQII and GPS operation • Optimize counter timing resolution and background rejection • Decide on gate width and buffer look-back pointer timing • Move Arrays to Current QuarkNet High Schools • Large Array analysis design • Data gathering and web posting • Mini-arrays and multiple arrays have different problems • Mini (in one room) time resolution is poor, rate high • Multiple arrays – large baseline, GPS timing uncertainty, low rates • Expand Array throughout Chicagoland in 2004 • Recruit new teachers/high schools • New hardware – large task. • CASA detectors – retrieve from Utah
Looking ahead. . . . Infrequently, cosmic ray showers occur at much higher energies than any proposed accelerators can produce. We are capturing Chicagoland showers. Through QuarkNet, more high school sites are added each year – students, teachers and research scientists all working together on High Energy Physics.
Acknowledgements Many thanks to: the UIC HEP group Professor Mark Adams for his guidance and unstinting mentorship Assoc. Professor Nikos Varelas Asst. Professor Cecilia Gerber Graduate Students Mario Camuyrano & Vasundhara Ranganathan QuarkNet/Notre Dame griPPed (Grid Particle Physics Education) Griphyn (Grid Physics Network)
Cosmic Shower Ratesfrom CASA and Auger Our UIC array is 0.02 km2 with 0.02% covered by scintillator High Schools array 400 km2 Very low coverage Efficiency can be high for smaller array – more than one shower at knee per week. I don’t know it for Chicago-wide array – several /yr.
GPS time synch method • GPS module delivers 2 kinds of data: • Serial data: 1 line (ascii text string) per second or on request • date and time in UTC (Universal Time) down to the millisec • 1PPS = 1 pulse per second • analog square pulse whose leading edge is accurately aligned with the beginning of each UTC second on the GPS System Master Clock: 1.000 sec 2.000 sec 3.000 sec SAMPLE DATA STRING: $GPRMC,075609.207,A,4739.2385,N,12218.6464,W,0.19,,251002,,*06 INTERPRETATION: Time (UTC) Date Latitude Longitude (housekeeping data) 07:56:09.207 25/10/2002 47:39.2385N 122:18.6464W A=valid 0.19 - - -
GPS time synch method • Method: • log value of onboard 41.7 MHz clock counter (1 tick ~ 24 nanosec) • for every event trigger (clock reading = NTRG) • for every 1 PPS pulse (clock reading = N1PPS ) • Difference between 1 PPS values calibrates the 41.7 MHz clock • TCLOCK ~ 24 nanosec = 1 sec / < DN1PPS > (avg DN over 60 sec) • Difference between count at last 1 PPS and at trigger gives time in units of clock period since last second began • Event timestamp = (yy/mm/dd) + (hh:mm:ss) + NTRG*Tclock nanosec
Data from the card Data status: 0=OK • Raw data format: 8-bit TMC/clock time when rising and falling edges of one channel occurred in trigger gate window (24 … 192 nanosec) Number of satellites in view GPS fix quality: A=OK, V=bad 3 9415C2D 3B 62 3E 65 00 00 00 00 48AA3F82 203038.615 180902 V 03 0 3 975DEC9 3E 71 45 6D 00 00 00 00 4A8462D0 203103.614 180902 V 04 0 Date: ddmmyy upper 28 bits of clock when trigger occured GPS time: hhmmss.ddd Hit channels (as binary code): "1" = 0001 = only channel 1 was active "2" = 0010 = only channel 2 was active "3" = 0011 = channels 1 and 2 were active etc. clock count when last GPS second rollover occurred
Data output from DAQII Raw Data followed by Compressed Data if valid event 80 is 100000 binary - sixth bit tags new trigger 520DD753 80 01 00 01 20 3E 00 01 5121C9D1 212402.572 210703 A 07 2 +0201 520DD754 25 31 00 01 00 01 00 01 5121C9D1 212402.572 210703 A 07 0 +0201 Vasu’s compressed file convert HEX to DEC, adjust for HOB and convert channels to ns 63 77043 371278896 27 36 0 22 D740B3D4 80 01 00 01 3B 01 00 01 D73E0E95 212456.569 210703 A 07 A +0204 D740B3D5 00 01 00 01 01 3A 39 01 D73E0E95 212456.569 210703 A 07 A +0204 D740B3D7 00 01 00 01 00 01 01 3B D73E0E95 212456.569 210703 A 07 8 +0204 D84B68DF 80 01 00 01 29 36 00 01 D73E0E95 212456.569 210703 A 07 A +0204 D84B68E0 23 2D 00 01 00 01 00 01 D73E0E95 212456.569 210703 A 07 8 +0204 EA12F785 80 01 34 39 2E 3F 00 01 E8A08944 212503.569 210703 A 07 0 +0205 70 77104 582637080 15 18 10 23 3E is 011110 binary - forth bit tags valid word 1E is 1110 binary = 30 decimal is time c1 c2 c3 c4 gps time and date GPS data valid? 0,2 OK, but 8, A are not GPS valid = A (not valid is V) Number of Satellites
Random Background Rates • Showers that extend over several mini-arrays are relatively rare, but our arrays are very quiet. • Random coincidences are low among mini-arrays even with two-fold triggers • 2-fold rate R is 1 event/60 seconds • 400ns gate width = 2.5E6 gate windows per second • Random Rate per week = R x (R/2.5E6)x(6E5s/week) • Random 2 mini-array rate per week = 8 E-5 • R for 3-fold is even smaller = 1 event/200 seconds • We can search for event rates at one per year for correlated mini-arrays!
Block diagram of Q'Net2 board only 2 of 4 channels shown • discriminators • relative time digitizer • same used in ATLAS, K2K • control logic • programmable logic chip • onboard CPU • onboard clock (crystal controlled oscillator + phase-locked loop) with 24-nanosecond "ticks" • environmental sensor inputs • GPS receiver • (external)
Fastest pulse Slowest pulse
Timing Considerations • We want counter separation > time jitter • Jitter in DAQ card ~ 1ns • Jitter along counter: • 11ns for E605 • 5 ns for lifetime counters • 2 ns for shortened E605 • Signal pulse height time slew • Separate counters until rates are too low pulse height time for smaller pulse is later time discriminator threshhold time for larger pulse is earlier trailing edge
UIC QuarkNet Large Array for detecting high energy cosmic rays List of Detectors: Location – exact position and descriptive Picture Physical layout of scintillator detectors Person in charge Link to data Data - Detector Site 1 Two different data files Raw data Data after first mini-array analysis: Time, azimuth, theta, number of hit detectors Data - Detector Site 2 Two different data files Raw data Data after first mini-array analysis: Time, azimuth, theta, number of hit detectors Full Array Analysis Display of data from detectors that are coincidence within xxx microsecond time window For each event: Coincidence Event Number, number of sites hit azimuth, theta errors from combined data Detector 1, Time, azimuth, theta, Detector 2, Time, azimuth, theta, Detector n, Time, azimuth, theta, Display of hit counters across Chicagoland Large Array DAQ, Web and Analysis Organizationbased on Visual Basic
A+E F SEL D C B SES UIC Large Array 6m 180m 25m
Work Shop 2003 Accomplishments Goal – Astronomy: Large Air Shower Array to capture very high energy cosmic rays Progress Report: Fall ‘02 – analyzed DAQ II data – first detector timing results March ‘03 – Abstract for Madison – No Small Plans No gps, one DAQ prototype (completely redone in April), few scintillators, no working new bases May ’03 - New DAQII working and mini-arrays ready in time for first workshop period Sten’s group (Erich, Heide, Terry), Tom, Hans (UWash) Pat – shortened scintillator Mario – GPS and DAQII (drilling holes in roof hatches with Bob P.) Vasu – beautiful software VB program that turned out to be XP-only. Rewrote completely in C++