Interaction fluide structure dans un faisceau de tubes : physique et modélisation
330 likes | 660 Vues
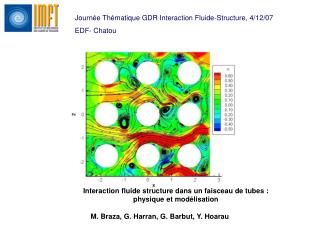
Journée Thématique GDR Interaction Fluide-Structure, 4/12/07 EDF- Chatou. Interaction fluide structure dans un faisceau de tubes : physique et modélisation M. Braza, G. Harran, G. Barbut, Y. Hoarau. Phénomènes physiques à capter par l’approche de macrosimulation :.

Interaction fluide structure dans un faisceau de tubes : physique et modélisation
E N D
Presentation Transcript
Journée Thématique GDR Interaction Fluide-Structure, 4/12/07 EDF- Chatou • Interaction fluide structure dans un faisceau de tubes : physique et modélisation • M. Braza, G. Harran, G. Barbut, Y. Hoarau
Phénomènes physiques à capter par l’approche de macrosimulation : • Instabilités de basse fréquence • bien distinctes par rapport à la turbulence aléatoire • Flottement hydroélastique • Prédiction deschargements proche-paroi: couplage dû à l’échange énergétique : fluide-structure
THE IMFT’s CIRCULAR CYLINDER - DESIDER EU program TEST-CASE In S1 Wind tunnel – IMFT : SIMULTANEOUS 3C-PIV and Time-resolved PIV Re=140,000 Longitudinal vortices along the span in connexion with the von Karman ones IUTAM Symposium Unsteady Separated Fmows and their Control, June 2007 and J. Fluids& Structures, in print
Vertical velocity spectrum in a cylinder wake, Re=140 000 The macrosimulation approach to capture the organised coherent motion and the random turbulence Spectrum from phase-averaged signals Spectrum from originals signals Experimental data from PIV (M. Braza,R. Perrin, Y. Hoarau, Journal of Fluids and Structure 2006) and LDV (Djeridi et al, JFTAC 2003)
OES : Organised Eddy Simulation Macrosimulation OES: Schematic separation of coherent/random turbulence parts in the spectral domain In the physical domain: phase average decomposition: Part (1): to be resolved Part (2): to be modelled by reconsidered statistical turbulence modelling, efficient in high-Re unsteady wall flows (Dervieux, Braza, Dussauge, Notes on Num. Fluid Mech., 1998, Vol. 65, Braza, Perrin, Hoarau, J. Fluids & Struct., 2006, Vol. 22
The phase-averaged turbulence stresses: • Evaluated by tensorial eddy-viscosity concept • Derived from second-order modelling <Ui>/ t + <Uj> <Ui>/ xj+ <uiuj>/ xj Temporal non-linear convection new turbulent stresses = - <P>/dxi+ ²<Ui>/ xj² Bourguet, Braza, Perrin, Harran, AIAA J., 45, 2007.
Anisotropic OES modelling Considerations from the « IMFT circular cylinder » exp. study – DESIDER EU program, Perrin et al, Exp. in Fluids, 42, 2006 Re=140,000 Bourguet et al, AIAA J, 45, 2007
Anisotropic OES Modelling: Tensorial eddy-viscosity concept* Directional Cmicoefficient, ajk : Turbulence stress anisotropy, Sij = Strain-rate tensor, advectable directional criterion derived from DRSM Sarkar, Gatski, Speziale transport eqns, JFM 227 *Bourguet, Braza, Perrin, Harran, AIAAJ. 45, 2007 Cmi= Cvie/k
Anisotropic OES modelling • Good agreement of experimental and modeled anisotropy tensor • Implementation into NSMB solver – PhD R. Bourguet
Comparison of the experimental and predicted phase-averaged turbulence shear-stress Bourguet, Braza, Perrin, Harran, AIAAJ, Vol.45,N°5, 2007
Anisotropic OES modelling • Yields simplified – isotropic OES – in agreement with our previous studies • derived by DRSM (Hoarau, Braza, IUTAM-02 Symposium Procs, Unsteady Separated Flows)
Flow around a NACA 0021 airfoil at 60° angle of attack OES approach and two-equation modelling (isotropic version) *Use of the modified damping function (Jin & Braza, AIAA J. 1994) derived from DNS *use of the eddy-diffusion coefficient adapted by OES/DRSM Cm=0.02
OES PIV -3C Moyenne de phase OES/k-w Fig. 4c. Up: Iso-U velocity averaged field compared with the PIV data, down, phase-averaged experimental field at phase-angle 225° compared with the DES-k-omega (IMFT).
OES approach: allows simulation of 3D shear-layer instability at high-Re Re=140,000 Q_criterion 3D structure of shear-layer instability
Interaction fluide-structure Faisceau de tubes
Variation de la vitesse critique en fonction du paramètre masse-amortissement (S. J. Price, M.P. Paidoussis, J. Fluids & Struct., Vol. 22, 2006) • Petit Nombre de Scruton • Instabilité dominée par l’amortissement • Implique un seule degré de liberté (SDOF). • Grand nombre de Scruton • Instabilité dominé par la raideur • Implique deux degrés de liberté.
y k U x c k c Modélisation linéaire des forces fluide-élastiques Re = 20000 Equation dynamique du cylindre SDOF Modèle de force fluide-élastique Connors (1970) quasi-statique Price,Païdoussis (1986) processus « amnésique » Granger Païdoussis (1996) processus à mémoire
Application à l’interaction fluide-structure dans un faisceau de tubes Code NSMB Navier-Stokes Multiblock Consortium: EPFL, CFS Engn, KTH, ETHZ, Tech. Univ. Münich, IMFT, IMFSS, RUAG Aero Présente application Approche ALE Schémas centrés Précision au second-ordre temporel et spatial Modélisation OES – modèles à deux équations, de type k-w 41616 cellules
Avec oscillation verticale du cylindre du milieu à la fréquence naturelle et amplitude 0.1D fréquence d’oscillation du cylindre fréquence du détachement tourbillonnaire Variation des coefficients de traînée et de portance en fonction du temps (Ur=1.18) Analyse spectrale du coefficient de la portance
III. Configuration étudiée Détail du maillage Domaine du calcul 144 blocs - 73728 cellules P/D=1.75
Variation des coefficients de traînée et de portance en fonction du temps Analyse spectrale du coefficient de la portance entre les instants t=83.06 s et t=301.6 s. f=0.21 Hz
ConclusionInteraction fluide-structure faisceau de tubes • Approche OES : • Evaluation des charges pariétales - échange énergétique fluide-structure • Dissociation parties organisée et interaction avec turbulence aléatoire • Approche 2D (méthode non-intrinsèque 3D) • Capacité de prédicition à plus haut Re
Perspectives • Développements actuels: • Prédiction faisceau de tubes avec A_OES • Prédiction en 3D • Analyse de l’instabilité de flottement – cylindres en tandem • Expérience physique avec TR-PIV/3C-PIV