THE FORECLOSURE CRISIS
210 likes | 347 Vues
THE FORECLOSURE CRISIS. BAY AREA CASE STUDY. Research Focus. Focus: U.S. Department of Housing and Urban Development (HUD) Neighborhood Stabilization Program (NSP) Research question: Is NSP funding the cities most in need? Analysis of foreclosure rates

THE FORECLOSURE CRISIS
E N D
Presentation Transcript
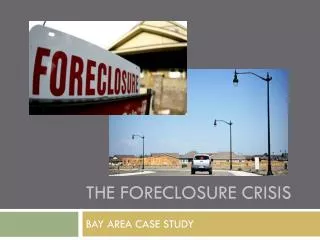
THE FORECLOSURE CRISIS BAY AREA CASE STUDY
Research Focus • Focus: U.S. Department of Housing and Urban Development (HUD) Neighborhood Stabilization Program (NSP) • Research question: Is NSP funding the cities most in need? • Analysis of foreclosure rates • Effects on low income and minority populations • Case study: San Francisco-Bay Area • Data sources: 2000 U.S. Census, 2005-2009 American Communities Survey, 2010 RealtyTrac, and 2011 HUD data
Case Study: Bay Area • One of the areas hardest hit by the foreclosure crisis • Nine Bay Area counties total • Four counties received NSP funds: Alameda, Contra Costa, Santa Clara, and Solano • Fivecounties were not funded: Marin, Napa, San Francisco, San Mateo, and Sonoma Source: 2010 U.S. Census Data
Bad News Nationwide • 2.9 million U.S. home foreclosures in 2010 • Nationwide 2% rise in foreclosures • 72% increase in foreclosures in large U.S. cities • Predictions of a 20% increase in foreclosures for 2011 Sources: “Foreclosures decline in California in 2010,” Alexander Lazo, The Los Angeles Times, January 13, 2011, “Foreclosure filings could swell 20% this year,” Dan Levy and Prashant Gopal, The Los Angeles Times, January 14, 2011 and “Foreclosures rose in 72% of U.S. cities in 2010,” Dan Levy, The Los Angeles Times, January 28, 2011
Better News for CA? • Over 500,000 California homes were in foreclosure in 2010 • 14% drop in foreclosures in California • 19 out of 20 cities with the highest foreclosure rate werein California, Florida, Nevada and Arizona Source: Alexander Lazo, “Foreclosures decline in California in 2010,” The Los Angeles Times, January 13, 2011 and “Foreclosures rose in 72% of U.S. cities in 2010,” Dan Levy, The Los Angeles Times, January 28, 2011
Note: State of California funding excluded. Source: 2010 U.S. Census and 2011 U.S Dept. of Housing and Urban Development Data NPS invested $7 billion of federal funds to mitigate “the impact of foreclosures through the purchase and rehabilitation of foreclosed, vacant properties in order to create more affordable housing and renew neighborhoods devastated by the economic crisis.”
NSP Summary • Created by the Housing and Economic Revitalization Act of 2009 (HERA) • Three rounds of NSP funding; two rounds of funds distributed by a formula and one round was a competitive application process • States, counties, cities, and nonprofits use NSP funds to purchase and/or rehabilitate foreclosed, blighted, or vacant properties • Households assisted must be 120% of area median income (AMI) and 25% of the grant must serve households below 50% AMI
Bay Area Demographics • 2005-2009 American Community Survey Data: • Total Population • Minority Population • Families Below Poverty Level • Median Household Income • Median House Value • Median Gross Rent • Foreclosures from June 2009-2010 RealtyTrac Data
Source: 2005-2009 American Community Survey and 2011 U.S. Dept. of Housing and Urban Development Data
Source: 2005-2009 American Community Survey Data and 2011 U.S. Dept. of Housing and Urban Development Data
Bay Area Housing Data The Bay Area is expensive: • Bay Area residents earn 25% more than other Californians • Home values in the Bay Area are nearly 30% higher than other places in California Source: 2005-2009 American Community Survey Data
Source: 2005-2009 American Community Survey Data and 2011 U.S. Dept. of Housing and Urban Development Data
Bay Area Foreclosures • 21,000 estimated foreclosures in the Bay Area in 2010 • Over 173,000 foreclosures in other CA counties Source: 2011 U.S. Dept. of Housing and Urban Development Data
Source: 2005-2009 American Community Survey, June 2009-2010 RealtyTrac, and 2011 U.S. Dept. of Housing and Urban Development Data
Source: 2005-2009 American Community Survey, June 2009-2010 RealtyTrac, and 2011 U.S. Dept. of Housing and Urban Development Data
Take Aways • The Bay Area is an expensive area with high housing costs • NSP funded counties in the Bay Area with high foreclosure rates • Funding is in dense, diverse areas • Funding is not in affluent or poverty areas • Foreclosures disproportionately affected minorities
Next Steps • Research income data for 120% of AMI and 50% AMI which coincides with NSP requirements • Review data on delinquent mortgages, house price change, and unemployment • Further analysis of each county in the Bay Area • Breakdown racial data by specific groups • Compare Bay Area and California data to U.S. data
Summary of GIS Skills • Geographic Information System (GIS) Skills Utilized: • Inset Map • Point Graduated Symbol • Aggregating Attribute Data • Attribute Sub-sets Selections • Boundary Sub-sets Selections • Geoprocessing Layers
Photo Credits • Slide #1 – The Los Angeles Times, December 18, 2007, Location: Palmdale, CA • Slide #1 - David Butow, The Los Angeles Times, January 6, 2011, Location: Stockton, CA