Download
1 / 64
940 likes | 1.48k Vues
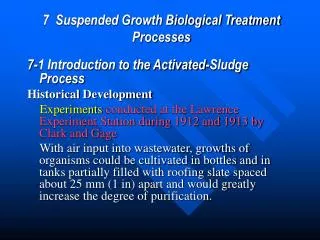
CE 548 I Suspended Growth Biological treatment Process. Activated Sludge Principles. Activated Sludge Principles. Wastewater is aerated in a tank Bacteria are encouraged to grow by providing Oxygen Food (BOD) Suitable temperature Time

E N D
CE 548 I Suspended Growth Biological treatment Process
Activated Sludge Principles • Wastewater is aerated in a tank • Bacteria are encouraged to grow by providing • Oxygen • Food (BOD) • Suitable temperature • Time • As bacteria consume BOD, they grow and multiply • Treated wastewater flows into secondary clarifier • Bacterial cells settle, removed from clarifier as sludge • Part of sludge is recycled back to activated sludge tank, to maintain bacteria population • Remainder of sludge is wasted
Applications of activated sludge processes ProcessApplication Conventional Low-strength domestic waste, susceptible to shock loads Complete-mix General application, resistant to shock loads, surface aerators Step-aeration General application to wide range of wastes Modified-aeration Intermediate degree of treatment where cell tissue in the effluent is not objectionable Contact-stabilization Expansion of existing systems, package plants, flexible Extended-aeration Small communities, package plants, flexible, surface aerators Kraus process Low-nitrogen, high strength wastes High-rate aeration Use with turbine aerators to transfer oxygen and control the floc size, generals application Pure-oxygen General application, use where limited space is available, requires expensive oxygen source, turbine or surface aerators
Design parameters for activated sludge processes Processq c (d)q (d)F/MQr/QX (mg/L) Conventional 5-15 4-8 0.2-0.4 0.25-5 1,500-3,000 Complete-mix 5-15 3-5 0.2-0.6 0.25-1 3,000-6,000 Step-aeration 5-15 3-5 0.2-0.4 0.25-0.75 2,000-3,500 Modified-aeration 0.2-0.5 1.5-3 1.5-5.0 0.05-0.15 200 – 500 Contact-stabilization 5-15 0.5-1 0.2-0.6 0.25-1 1,000-3,000 3-6 4,000-10,000 Extended-aeration 20-30 18-36 0.05-0.15 0.75-1.5 3,000-6,000 Kraus process 5-15 4-8 0.3-0.8 0.5-1 2,000-3,000 High-rate aeration 5-10 0.5-2 0.4-1.5 1-5 4,000-10,000 Pure-oxygen 8-20 1-3 0.25-1.0 0.25-0.5 6,000-8,000
Operational characteristics of activated sludge processes Process Flow modelAeration systemBOD5 removal efficiency (%) Conventional Plug-flow Diffused air, mechanical aerators 85-95 Complete-mix Complete-mix Diffused air, mechanical aerators 85-95 Step-aeration Plug-flow Diffused air 85-95 Modified-aeration Plug-flow Diffused air 60-75 Contact-stabilization Plug-flow Diffused air, mechanical aerators 80-90 Extended-aeration Complete-mix Diffused air, mechanical aerators 75-95 Kraus process Plug-flow Diffused air, mechanical aerators 85-95 High-rate aeration Complete-mix Diffused air, mechanical aerators 75-90 Pure-oxygen Complete-mix Mechanical aerators 85-95
Wastewater Characterization • AS design requires determining: 1.) aeration basin volume 2.) sludge production 3.) oxygen needed and 4.) the effluent concentration of important parameters. • To design AS process, characterization of wastewater is required. • Wastewater characteristics T8-1, p.666 can be grouped into the following categories: • carbonaceous substrates, • nitrogen compounds, • phosphorus compounds, • total and volatile suspended solids, • and alkalinity.
Wastewater Characterization • Carbonaceous Constituents. Measured by BOD or COD. • Unlike BOD, some portion of COD is nonbiodegradable. COD is fractionalized in F8-4, p.668. • Of interest is whether the COD is dissolved or soluble and how much is particulate, comprised of colloidal and suspended solids. • The nonbiodegradable soluble COD, nbsCOD, will be found in the AS effluent and the nonbiodegradable particulates will contribute to the sludge. • Because the nonbiodegradable particulate COD, nbpCOD, is organic, it will contribute to the VSS concentration of the wastewater and mixed liquor in the AS and is referred to as the nonbiodegradable volatile suspended solids, nbVSS.
Wastewater Characterization • The influent wastewater will also contain nonvolatile influent suspended inert solids, iTSS, that add to the MLSS. • For biodegradable COD, understanding the fractions that are measured as soluble, soluble readily biodegradable (rbCOD), and particulate is important for AS process design. • The rbCOD is quickly assimilated by the biomass, while the particulate, must first be dissolved by extracellular enzymes and are thus assimilated at much slower rates. • The rbCOD is of particular interest, T8-3, p.669, and has a direct effect on the AS biological kinetics and process performance.
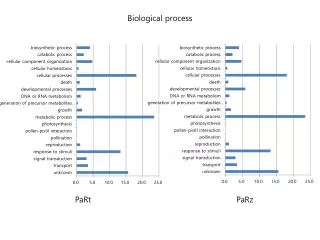
A: Oxygen used for rbCOD • B: Oxygen used for nitrification • C: Oxygen used for particular COD • D: Oxygen used for endogenous decay
Wastewater Characterization • COD and BOD may be correlated as the following: bCOD consumed in the BOD test is equal to the oxygen consumed (UBOD) plus the oxygen equivalent of the remaining cell debris: bCOD = UBOD + 1.42 fd (YH) bCOD bCOD/BOD ratio varies between 1.6-1.7.
Wastewater Characterization • Nitrogenous Compounds. F8-5, p.670 • Alkalinity: Adequate alkalinity is needed to achieve complete nitrification, about 7.07 g CaCO3/gNH4-N. • Additional alkalinity must be available to maintain the pH in the range 6.8-7.4. • Typically the amount of residual alkalinity required to maintain the pH near neutral is between 70 and 80 mg/l as CaCO3.
Wastewater Characterization • Summary Tabulation. P. 673. COD = bCOD + nbCOD bCOD = 1.6BOD nbCOD = nbsCOD + nbpCOD bCOD = sbCOD + rbCOD TKN = NH4-N + ON ON = bON + nbON nbON = nbsON + nbpON Where terms are defined in T8-2, p.667. Study example 8-1 p 674
Fundamentals of Process Analysis and Control • Process design considerations: • Reactor type • Kinetics • SRT • Sludge production • Oxygen requirements • Others • Reactor type selection considerations. T8-4, p. 678. • Kinetics, summary of equations. T8-5, p.679. • SRT: The SRT in effect represents the average period of time during which the sludge has remained in the system and used to be called the mean cell residence time. In AS sludge design it is the MOST critical parameter as it affects just about every element of design. The SRT is typically 3-5 days, T8-6, p.680.
Fundamentals of Process Analysis and Control • Sludge production: Excess solids are produced in the AS process and must be properly disposed of or they will accumulate and exit in the effluent. • PX,VSS = YobsQ(S0-S)(1kg/103g) eq. 8-14, p.681 The Yobs term is illustrated in F8-7, p.682. • Oxygen Requirements: If all of the bCOD were oxidized, the oxygen demand would equal the bCOD concentration. However, bacterial oxidize a portion of the bCOD to provide energy and use the remaining portion of the bCOD for cell growth. Oxygen is also used for endogenous respiration which is a function of the SRT. The total oxygen requirement including nitrification is: R0 = Q(S0-S) – 1.42PX,bio + 4.33Q(NOx) eq. 8-17, p.683 The last term deals with the effects of nitrogen.
Fundamentals of Process Analysis and Control • Nutrient requirements: Based on cell mass, 12.4% by weight of nitrogen is required and phosphorus is usually assumed to be about 1/5 of the nitrogen. As a general rule, for SRT values > 7d, about 5g of N and 1g of P will be required per 100g of BOD. • ML Settling Characteristics: In the final clarifier, the MOs must be separated. A commonly used measure of settling characteristics is the SVI, the sludge volume index. The SVI is the volume of 1g of sludge after 30 minutes of settling. The numerical value is calculated from the test as follows: SVI = = ml/g eq. 8-19
Fundamentals of Process Analysis and Control • Example: • Given: A ML has a TSS of 3500mg/l and settles to a volume of 275 in 30 minutes in a 1L cylinder. Find: SVI SVI = = = 78.6 ml/g SVI = 78.6 ml/g A value of 100 mL/g is considered a good settling sludge and SVI values below 100 are desired. SVI values above 150 are typically associated with a problem, filamentous growth.
Fundamentals of Process Analysis and Control • Secondary Clarification: The design is typically based on the surface overflow rate and solids loading rate, T8-7, p.687. Overflow rates are based on wastewater flow rates instead of ML flowrates. Solids loading rate:
Fundamentals of Process Analysis and Control • Effluent Characteristics: The major parameters of interest are • organic compounds, sBOD usually less than 3 mg/l • suspended solids, 5-15 mg/l • and nutrients. • Process Control. • Maintaining DO in the aeration tanks. • Regulating RAS • Controlling WAS • The most commonly used parameter for controlling the AS process is SRT. The waste AS flow from the recycle line is usually used to maintain the desired SRT. The MLSS is also used as a control.
Fundamentals of Process Analysis and Control • The DO should be 1.5-2 mg/l in all areas of the aeration tank. Values above 2 mg/l may improve nitrification (when BOD is high). Values above 4 mg/l do not improve operations but significantly increase aeration costs. • RAS Control: • The RAS is returned from the final clarifier to the inlet of the aeration tank. • The solids form a sludge blanket in the bottom of the clarifier. • Return sludge pumping rates of 50-75% of the average design wastewater flowrates are typical. However, the design average capacity is typically 100-150% of the average design flowrate. • Return AS concentrations from the secondary clarifier range typically from 4000-12,000 mg/l.
Fundamentals of Process Analysis and Control • Settleability: To calculate return-sludge flowrate, several techniques are used: Settleability test: In a 1000 ml graduated cylinder the volume of settleable solids after 30 minutes is divided by the volume of clarified liquid (supernatant). SVI (Sludge Volume Index) test:
Fundamentals of Process Analysis and Control • Sludge Wasting: To maintain a given SRT, the excess AS produced each day must be wasted, WAS. • The sludge can be wasted from the RAS line or the aeration tank. • The RAS is more concentrated thereby requiring smaller pumps. • The WAS is discharged to the primary sedimentation tanks for co-thickening or to sludge thickening facilities prior to digestion. • If wasting is from the RAS line: • If wasting is done from the aeration tank:
Fundamentals of Process Analysis and Control • Operational Problems: • Bulking sludge: The MLSS floc does not compact or settle well and floc is discharged in the clarifier effluent. The principal cause is filamentous bacteria which are very competitive at low substrate, nutrient or DO conditions. • Rising sludge: • The sludge has good settling characteristics but rises to the surface. • The most common cause is denitrification in which nitrites and nitrates are converted to nitrogen gas, N2 which makes the mass buoyant. • Rising sludge is differentiated from bulking sludge by the presence of small gas bubbles and floating sludge in the secondary clarifiers. • Rising sludge problems may be overcome by reducing the detention time in the clarifier by increasing the RAS rate.
Fundamentals of Process Analysis and Control • Operational Problems: • Foaming: • Nocardia can be responsible for excessive foaming. • The bacteria have hydrophobic cell surfaces and attach to air bubbles where they stabilize the bubbles to cause foam. • Usually found above the ML. • Nocardia can by controlled by avoiding trapping foam in the secondary treatment process and using chlorine spray.
Processes for BOD Removal and Nitrification • Three Activated-Sludge process design examples are provided in this section (8-4) to demonstrate the application of the fundamental principles to BOD removal and nitrification. • The examples are: • A single sludge complete-mix activated-sludge process without and with nitrification. Example 8-2 • A sequencing batch reactor (SBR) with nitrification. Example 8-3 • A staged nitrification process. Example 8-4
Processes for BOD Removal and Nitrification Sequencing Batch Reactor • (SBR) is a fill-and-draw activated-sludge treatment system. In SBR aeration and sedimentation are carried out sequentially in the same tank.The process takes place in five steps: • fill : • addition of wastewater to reactor • liquid level rises from 25% to 100% • normally lasts 25% of full cycle time • react: • complete the reaction • Lasts 35% of cycle time.
Processes for BOD Removal and Nitrification Sequencing Batch Reactor • settle: • to allow solid separation to occur • more efficient than continuous flow systems. • Lasts 20% • draw: • to remove clarified treated waste lasts from • 5 - 30% of cycle time, typically 45 minutes • idle: • to provide time for one reactor to complete its fill cycle before switching to another unit. • Sometimes omitted.
Processes for BOD Removal and Nitrification Sequencing Batch Reactor • sludge wasting usually occurs during settle or idle phases. • no need for recycling; both aeration and settling occur in the same chamber • Process kinetics: Accumulation = inflow – outflow + reaction
Processes for BOD Removal and Nitrification Staged activated-sludge process • Consists of a series of complete-mix reactors. • For the same reactor volume, rectors in series can provide greater treatment efficiency than a single complete-mix reactor, or provide a greater treatment capacity. • The oxygen uptake is higher in the first stage and decreases gradually.
Processes for BOD Removal and Nitrification Overview of biological nitrogen removal processes • All biological nitrogen removal processes include aerobic zone (nitrification) and anoxic zone (denitrification). • Categories of suspended growth biological nitrogen removal processes include (1) single-sludge or (2) two-sludge. • Single-stage processes: (three types) • preanoxic: initial contact of influent and return activated sludge is in the anoxic zone. (commonly used) • Postanoxic: anoxic zone follows the aerobic zone. • Simultaneous nitrification-denitrification (SNdN): both zones exisis in a single reactor. Requires DO control. • Two-sludge processes: consists of two separate stages for nitrification followed by denitrification. (not commonly used)
Preanoxic Postanoxic
Simultaneous Two-sludge
Processes for Phosphorous Removal Process for biological phosphorous removal • Three biological phosphorous removal (BPR) configuration are commonly used: • Phoredox (A\O): represent any process with an anaerobic/aerobic sequence to promote BPR. Nitrification does not take occur. • A2O: process sequence, anaerobic/anoxic/aerobic. Nitrification takes place. • UCT (University of Cape Town): used for weak wastewater where the addition of nitrate would have significant effect on the BPR performance. • The PhoStrip process: combines biological and chemical processes for phosphorous removal.
Design of Physical Facilities for AS Process Design of Aeration Tanks After selecting the activated sludge process and the aeration system, the next step is to design the aeration tanks and support facilities. Aeration Tanks: • constructed of reinforced concrete • capacity is determined from process design • for plants in a capacity range of 0.5 – 10 Mgal/d minimum two tanks 10 – 15 Mgal/d 4 tanks >50 Mgal/d > 6 tanks Some large plans have 30 to 40 tanks
Design of Physical Facilities for AS Process Aeration Tanks: • wastewater depth in the tank should be 15 – 25 ft for diffusers to work efficiently. • free board from 1 – 2 ft above waterline should be provided • width to depth ratio 1:1 – 2.2:1 (1.5:1 is common) • for large plants channel length can exceed 500 ft per tank • tanks may consist of one to four channels • length-to-width ratio of each channel should be at least 5:1 • for mechanical aeration system, one aerator per tank is commonly used with a free board 3.5 – 5 ft
Suspended Growth Aerated Lagoons • Consists of shallow earthen basins varying in depth from 2-5m provided with mechanical aerators. • mechanical aerators provide oxygen and mixing • Suspended growth aerated lagoons are operated on a flow-through basis or with recycle. • Lagoons with solid recycle are essentially the same as the activated sludge process. • Types of Suspended growth aerated lagoons: • Facultative partially mixed • Aerobic flow-through with partial mixing • Aerobic with solids recycle and nominal complete mixing • The general characteristics of these lagoon systems are summarized in Table 8-29