Thickness and the Thermal Wind Relationship
570 likes | 1.07k Vues
April 12, 2006. Thickness and the Thermal Wind Relationship. Data Analysis Project Thickness and the Thermal Wind Next Week. Today. Due May 7 th You will be provided with pre-analyzed maps of surface pressure and temperature for 00Z and 12Z on 10 November 1998 and 00Z on 11 November 1998

Thickness and the Thermal Wind Relationship
E N D
Presentation Transcript
April 12, 2006 Thickness and the Thermal Wind Relationship
Data Analysis Project • Thickness and the Thermal Wind • Next Week Today
Due May 7th • You will be provided with pre-analyzed maps of surface pressure and temperature for 00Z and 12Z on 10 November 1998 and 00Z on 11 November 1998 • I will also try to provide satellite and radar imagery at various times throughout the storm’s development as well • You will be expected to analyze and describe the growth and progression of the cyclone over the course of its lifetime Final Project
Occurred on the Canadian/US border from November 10th to November 12th 1998 • Noteworthy facts: • Similar storm to the one that sank the Edmund Fitzgerald • Created severe winter weather across the Midwest • This storm intensified rapidly and broke the low pressure record for certain areas across the Midwest About the Storm
A Thought Experiment: Start with a column of air.
A Thought Experiment: The base of this column is at the surface, so lets say its pressure is about 1000mb. 1000mb
A Thought Experiment: The top of this column is quite high—let’s say that its pressure is 500mb. 500mb 1000mb
A Thought Experiment: This column has some thickness: there is some distance between 1000mb and 500mb. 500mb 1000mb
A Thought Experiment: If we heat the column of air, it will expand, warm air is less dense. The thickness of the column will increase. 500mb is now farther from the ground. 500mb 1000mb Warmer
A Thought Experiment: If we cool the column of air, it will shrink, cool air is more dense. The thickness of the column will decrease. 500mb is now closer to the ground. 500mb 1000mb Colder
A Thought Experiment: In fact, temperature is the ONLY factor in the atmosphere that determines the thickness of a layer! It wouldn’t have mattered which pressure we had chosen. They are all higher above the ground when it is warmer….
…whereas it is quite low to the ground near the poles. 700mb
These layers are much less “thick”. See how “thick” these layers are.
Let’s think about what this means near a polar front, where cold air and warm air are meeting.
This is a cross section of the atmosphere. North COLD South WARM
Cold air is coming from the north. This air comes from the polar high near the North Pole. North COLD South WARM
Warm air is coming from the south. This air comes from the subtropical high near 30°N. North COLD South WARM
These winds meet at the polar front. POLAR FRONT North COLD South WARM
Now, think about what we just learned about how temperature controls the THICKNESS of the atmosphere. POLAR FRONT North COLD South WARM
On the warm side of the front, pressure levels like 500mb and 400mb are going to be very high above the ground. 400mb 500mb POLAR FRONT North COLD South WARM
On the cold side of the front, pressure levels like 500mb and 400mb are going to be very low to the ground. 400mb 500mb 400mb 500mb POLAR FRONT North COLD South WARM
Above the front, the thickness of the atmosphere changes rapidly. 400mb 500mb 400mb 500mb POLAR FRONT North COLD South WARM
Now, let’s think about the pressure gradient force above the front. 400mb 500mb 400mb 500mb POLAR FRONT North COLD South WARM
Let’s draw a line from the cold side of the front to the warm side. 400mb A 500mb B 400mb 500mb POLAR FRONT North COLD South WARM
What is the pressure at point A? 400mb A 500mb B 400mb 500mb POLAR FRONT North COLD South WARM
The pressure at point A is less than 400mb, since it is higher than the 400mb isobar on this plot. Let’s estimate the pressure as 300mb. 400mb A 500mb 300mb B 400mb 500mb POLAR FRONT North COLD South WARM
What is the pressure at point B? 400mb A 500mb 300mb B 400mb 500mb POLAR FRONT North COLD South WARM
The pressure at point B is more than 500mb, since it is lower than the 500mb isobar on this plot. Let’s estimate the pressure as 600mb. 400mb A 500mb 300mb B 400mb 600mb 500mb POLAR FRONT North COLD South WARM
The pressure gradient force between point B and point A is huge! 400mb A 500mb 300mb B 400mb 600mb 500mb POLAR FRONT North COLD South WARM
Therefore, all along the polar front, there will be a strong pressure gradient force aloft, pushing northward. 400mb A 500mb 300mb B 400mb 600mb 500mb POLAR FRONT North COLD South WARM
Key Points: This strong pressure gradient force happens: Aloft (above the surface) Directly above the Polar Front Also, this force pushed toward the north (in the Northern Hemisphere).
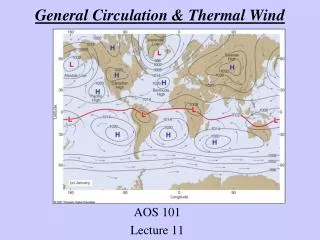
Polar Front and The Jet • So, how does this all cause the midlatitude jet stream?
Polar Front and The Polar Jet • Suppose we have a polar front at the surface. This purple line is the polar front at the surface. As we’ll learn, this is NOT how fronts are correctly drawn, but it will work for now.
Polar Front and The Jet • All along the front, there is a strong pressure gradient force pushing northward.
Polar Front and The Jet • Winds aloft are in geostrophic balance…
Polar Front and The Jet • …so the true wind will be a WEST wind, directly above the polar front.
Another View: Here’s the same diagram, shown from a slightly different angle, which might make this all more clear.
In Perspective: Here is the polar front at the surface.
In Perspective: Remember, it’s a polar front because it is where warm air from the south meets cold air from the north.
In Perspective: The midlatitude jet stream is found directly above the polar front.
Conclusions: The Midlatitude Jet Stream is found directly above the polar front, with cold air to the LEFT of the flow. This is because of the changes in THICKNESS associated with the polar front. This process is known as the THERMAL WIND RELATIONSHIP.
The Thermal Wind • As mentioned in lecture last week, the wind at upper levels can be considered to be in geostrophic balance • As altitude increases, so does the PGF, which causes an increase in the magnitude of the wind • The vertical change in the magnitude of the geostrophic wind is proportional to the temperature gradient and is known as the “geostrophic wind shear” or the “thermal wind” • The Thermal Wind is not an actual wind, rather it is a measure between the wind at two different levels
The Thermal Wind • VT = Vupper – Vlower or Vupper = VT + Vlower • From this relationship we can determine the directional change in the wind between two levels. • This information can tell us about the type of temperature advection present in an area.
Veering Winds with Height • Veering winds rotate in a clockwise direction with height • Since the Thermal Wind always points in the direction where the cooler air is to its right, veering winds are indicative of warm air advection
Backing Winds with Height • Backing winds rotate counter-clockwise with height • They are indicative of cold air advection
Next Week • More information on the final project • Horizontal Cyclone Structure • No assignment is due for next week!