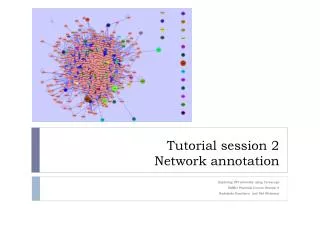
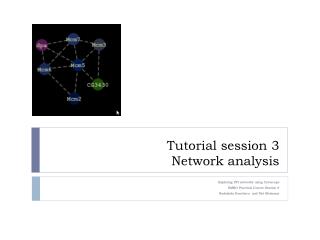
Tutorial session 3 Network analysis
Tutorial session 3 Network analysis. Exploring PPI networks using Cytoscape EMBO Practical Course Session 8 Nadezhda Doncheva and Piet Molenaar. Overview. Focus: Network analysis Identify active subnetworks Analyze Gene Ontology enrichment Perform topological analysis

Tutorial session 3 Network analysis
E N D
Presentation Transcript
Tutorial session 3Network analysis Exploring PPI networks using Cytoscape EMBO Practical Course Session 8 Nadezhda Doncheva and Piet Molenaar
Overview • Focus: Network analysis • Identify active subnetworks • Analyze Gene Ontology enrichment • Perform topological analysis • Find network clusters • Find network motifs • Concepts • Enrichment • Clustering • Guild by association • Data • Stored sessions; Drosophila and Neuroblastoma
Identify active subnetworks • jActiveModules plugin • Active modules are sub-networks that show differential expression over user-specified conditions or time-points • Microarray gene-expression attributes • Mass-spectrometry protein abundance • Input: interaction network and p-values for gene expression values over several conditions • Output: significant sub-networks that show differential expression over one or several conditions
Use case; Assignment 3.1 • Using neuroblastoma cell lines inhibitors to elucidate important pathways • 2 neuroblastoma cell lines: SHEP21, SY5Y • 7 inhibitors • Profiled on Affymetrix array • http://r2.amc.nl • Other resource e.g. GEO
Use case; Assignment 3.1 • Systematic perturbations • Different cell-lines • Including controls: DMSO • 97 arrays: data collected from R2: hugo-once etc PIK90 PI3K-dependent Cell lines -SY5Y -D425 RAS/ERK-dependent Cell lines -SHEP2 -RD RAS PI3K AKTi 1/2 MK2206 RAF AKT PI103 MEK U0126 Harvest: RNA Affy (97samples) protein WB mTORC1 mTORC2 ERK PI3K signature RAS/ERK signature Rapamycin PP242
Use case; Assignment 3.1 • Open the Neuroblastoma session and load the pvalues from this experiment • Run jActiveModules on the annotated network • What regions are important? • Can you imagine any caveats for this method?
Assignment 3.1: results • Important regions • Several clusters; those with most mutations might deliver additional wet lab testable pathway players (drugtargets?) • Caveats: • Maintenance (housekeeping) processes • Known pathways only
Gene Ontology • Provides three structured controlled vocabularies (ontologies) of defined terms representing gene product properties: • Biological Process (23074 terms): biological goal or objective • Molecular Function (9392 terms): elemental activity/task • Cellular Component (2994 terms): location or complex
Analyze Gene Ontology enrichment • BiNGO plugin: http://www.psb.ugent.be/cbd/papers/BiNGO/Home.html • Calculates over-representation of a subset of genes with respect to a background set in a specific GO category • Input: subnetwork or list, background set by user • Output: tree with nodes color reflecting overrepresentation; also as lists • Caveats: Gene identifiers must match; low GO term coverage, background determining
Use case; Assignment 3.2 • Open the Neuroblastoma session and run BiNGO on the filtered network. • What categories are enriched? • Can you find these back in the article?
Assignment 3.2: results • Quite some categories! • Filter out less informative top level categories: in several deeper categories neuron projection pops up • A clustering method can specify • Use subsets only • Worth mentioning: other tools eg. David • In second cluster neuron projection clearer; and large set of mutated genes
Compute topological parameters • NetworkAnalyzer plugin: http://med.bioinf.mpi-inf.mpg.de/netanalyzer/ • Computes a comprehensive set of simple and complex topological parameters • Displays the results in charts, which can be saved as images or text files • Can be combined with the ShortestPath plugin http://www.cgl.ucsf.edu/Research/cytoscape/shortestPath/index.html
Identify hubs • CytoHubba plugin: http://hub.iis.sinica.edu.tw/cytoHubba/ • Computes several topological node parameters • Identifies essential nodes based on their score and displays them in a ranked list • Generates a subnetwork composed of the best-scored nodes
Use case; Assignment 3.3 • Open the Drosophila network session • Check the network parameters • Is it scale free? • Can you find important players?
Assignment 3.3: results • It is scalefree; the node degree distribution fits a power law • Depends on the type of player you want to find; between processes or master regulator over number of genes?
Find network clusters • Network clusters are highly interconnected sub-networks that may be also partly overlapping • Clusters in a protein-protein interaction network have been shown to represent protein complexes and parts of biological pathways • Clusters in a protein similarity network represent protein families • Network clustering is available through the MCODE • Cytoscape plugin: http://baderlab.org/Software/MCODE
Use case; Assignment 3.4 • Open the Drosophila session • Run the MCODE algorithm • Run the MCL clustering algorithm • Compare the results • Can you corroborate some of the clusters found in the article? • Are there additional filtering options? • Play with the settings and observe their influence
Assignment 3.4: results • MCODE gives fuzzier clusters • E.g. the syx-syb cluster • The cluster parameters are set as attributes; these can be used to filter • Less stringent settings will produce additional clusters, but also larger clusters
Find network motifs • NetMatch plugin: http://alpha.dmi.unict.it/~ctnyu/netmatch.html • Network motif is a sub-network that occurs significantly more often than by chance alone • Input: query and target networks, optional node/edge labels • Output: topological query matches as subgraphs of target network • Supports: subgraph matching, node/edge labels, label wildcards, approximate paths
Use case; Assignment 3.5 • In the Drosophila session try to find a feedforward motif • Finally toy around with the settings of the Vizmapper to produce a nice paper-ready figure!
Assignment 3.5: results • Simple feed forward gives lots of matches • Add attributes, or make more complex queries • Toying around can produce nice results!
Other Useful Plugins • PSICQUICUniversalClient • AgilentLiteratureSearch • GeneMANIA • CyThesaurus • structureViz • ClusterMaker • EnrichmentMap • PiNGO • ClueGO • RandomNetworks
Wrapping up… • Biological questions • I have a protein • Function, characteristics from known interactions • I have a list of proteins • Shared features, connections • I have data • Derive causal networks • Network • Topology • Hubs • Clusters New hypotheses
End! And a final note…..
Announcing Cytoscape 3.0 Beta • Easier data import • Improved user experience • Graphical annotations • One-click install from AppStore • Improved API for app developers http://cytoscape.org