Download
1 / 23
230 likes | 337 Vues
ESA Plasma Instrument End of Prime Mission Review. Dr. James McFadden and Dr. Charles Carlson UC Berkeley SSL. Requirements and Specifications. Measurement

E N D
ESA Plasma Instrument End of Prime Mission Review Dr. James McFadden and Dr. Charles Carlson UC Berkeley SSL
Requirements and Specifications • Measurement • The ESA instrument measures 3-D electron and ion energy distribution functions over the Energy range 10 eV to 30 keV. Typical energy sweep has 16 or 32 energy samples • A full 4-pi distribution measurement is produced during each spin • Sweep rate of 32/spin gives dense sample of 3-D particle distributions • Raw measurements are compressed to selectable “reduced distributions” and moments • Implementation • Ion and electron “top-hat” electrostatic analyzers have 180 degree field of view • Field of view is divided into 8 electron and 16 ion elevation bins • Plasma analyzers have hardware programmed functions: sweep rate, sweep waveform, energy range, data collection rates. These functions are set by command. • Higher level data formatting and computed products are carried out in the ETC board. • Energy sweep is exponential with programmable starting energy and step ratio • ESA Plasma Instrument continues to operate nominally producing high quality data products with no anomalous behavior.
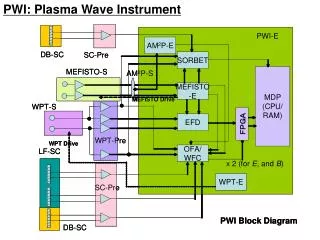
Block Diagram • Electronics functional design is identical to FAST (with ACTEL upgrades) • Three circuit modules plug together for efficient assembly and test • MCP pulse amplifiers are Amptek A121 with programmable gain • All discrete logic, counters, and HV DAC drivers are Actel FPGAs • HV supplies are a mature design built at UCB SSL
ESA efforts to facilitate data analysis • ESA data is available within 24 hrs after collection • ESA instrument performance is described in two publications : • McFadden, J.P., Carlson, C.W., Larson, D., Angelopoulos, V., Ludlam, M., Abiad, R., Elliott, B., Turin, P., Marckwordt, M. (2008), The THEMIS ESA plasma instrument and in-flight calibration, Space Sci. Rev., doi: 10.1107/s11214-008-9440-2. • McFadden, J.P., Carlson, C.W., Larson, D., Bonnell, J., Mozer, F., Angelopoulos, V., Glassmeier, K.-H., Auster, U. (2008), THEMIS ESA first science results and performance issues, Space Sci. Rev., doi: 10.1007/s11214-008-9433-1. • Detailed instrument parameters are available on the THEMIS ESA web page: http://themis.ssl.berkeley.edu/esa_table.shtml • Data products are describe on the THEMIS ESA web page: http://themis.ssl.berkeley.edu/modes_dataproducts.shtml • Sources of non-ideal response in ESA data are described on the THEMIS web site: http://themis.ssl.berkeley.edu/non_ideal.shtml
ESA Moment Accuracy ESA data demonstrated to be accurate in when ESA energy range contains all significant plasma. Ne=Ni Pressure balance demonstrated across the magnetopause.
Bow Shock and Foreshock Good density agreement in sheath & foreshock where ions are hot.
Solar Wind Measurements Solar wind mode allows the THEMIS ESAs, which were not optimized for the intense solar wind ion flux, to perform adequately, without saturation as demonstrated by Ni=Ne. With corrections for s/c charging, solar wind electrons are accurately measured as demonstrated by agreement between components of Vi and Ve.
Cross Calibration with EFI BxByBz ExEyEz eSST eESA iSST iESA Ni Ne VxVyVz VllVperp Ex-VxBx Ey-VxBy Ez-VxBz
ESA and SST combined Accurate density measurements Errors in electron velocity measurements due to density fluctuations
MCPs monitored monthly ESA’s MCP detectors have been monitored monthly since the commissioning phase to test for any degradation and to maintain proper gain. The tests toggle the preamplifier threshold between the nominal value of ~30 fC to a value equal to the nominal gain (~160 fC). Variations in counts that are less than a factor of 2 demonstrate good MCP detector gain. MCPs show little evidence of any average degradation. MCP bias voltages have not required changes for a year. Ions Electrons
Intense Solar Wind Ions Concern existed that intense solar wind ions might saturate the MCP detectors and degrade response. Detector threshold is toggled from nominal values through increasing threshold level to reveal actual MCP gain. These tests show that MCPs signals decrease in amplitude, but not enough to impact detection at nominal threshold. Solar wind electrons with nominal MCP full threshold toggle test provide a baseline for comparison. Ions Electrons
Bremsstrahlung Background Energetic electrons measured by the SST detectors produce X-rays that contaminate the ion ESA measurement. Moment calculations without removal of this background will overestimate ion density (green). Simple background removal algorithms (black) help, but still do not provide good agreement with electron density (red). Electrons Ions
eSST Determines iESA Bgnd We estimate background using both the eSST and iESA data. Cross fitting these two estimates allows corrections due to changes in response with time. Using eSST rather than iESA estimate eliminates removal of real counts at low energy. Background Electrons Ions Density after background subtraction
ESA Non-ideal Behavior ESA data is not perfect and the THEMIS web site and instrument papers outline sources of non-ideal response. For example, even with accurate density measurements, errors in electron velocity measurements may be present due to density fluctuations on the time scale of the spacecraft spin period.
Electron ESA MCP degradation Another minor source of non-ideal behavior was discovered after the first tail season, when the eESA experienced high count rates at low energy due to photo-electrons from the axial booms. This change in detector response necessitated modifications to the ground software and added several months to the in-flight calibration effort. Such changes were necessary in order to get accurate electron moments, especially in the solar wind. Response before first tail season. Response after first tail season.
ESA Lessons Learned • Analyzer concentricity essential to good measurements and can be easily achieved with a good design. • Tuning the analyzers to have identical energy sweeps greatly simplifies data analysis and in-flight calibrations. • Coast phase with close proximity of multiple satellites greatly simplifies cross calibration of instruments. • Fast signal amplifiers (short dead-time) are essential for ESAs on magnetospheric missions. • Multiple data products that complement each other greatly simplify data analysis and in-flight calibration efforts. • Built in test electronics simplifies in-flight instrument monitoring. • Leakage fields through analyzer grids can impact sensor response • MCP droop in intense solar wind not important. • Two electron sensors looking in opposite directions are essential for accurate Ve measurements when density fluctuations are present. • Ebanol-C is better than Gold Black for UV rejection. • Combined plasma measurements (ESA+SST) are required for correct plasma moment calculations.
Publication History and Data Maturity • THEMIS Papers utilizing ESA Data: • 2008 – 2 ESA instrument papers published • 2008 – 22 science papers published • 2009 – 26 papers published to date • 2009 – >16 papers submitted • Data Analysis Software • ESA raw and level 2 data available within ~24 hrs of collection. • Data analysis tools available to all, regular improvement to software. • Level 2 data is regenerated after significant changes to software. • Data will continue to improve with age like a good bottle of wine. • The ESA team will continue to assist the science community, facilitating access to ESA data and evaluating proper use of these data, when possible, within our limited resources.
Summary Performance • ESA Prime mission requirements • No failures or anomalies during prime mission • ESA met all mission and science requirements • ESA met or exceeded all performance requirements • ESA team has provided software and calibrated data • Over 50 papers with ESA data published • ESA Current Status • No noticeable degradation of HV sweep supplies • MCPs have >1kV head room for future bias voltage increases if needed • No increase in background noise since launch • In-flight calibrations correct for low-energy localized degradation of electron detectors • No significant localized degradation for ion sensors exposed to intense solar wind fluxes.
Future Improvements • ESA Data Work in Progress • Bremsstrahlung X-ray background subtraction • GF corrections for eESA low energy MCP degradation • New software algorithms for more accurate moments • New software algorithms to handle glitches in s/c potential • Algorithms to calculate density based on s/c potential • ESA Planned Developments • Scattered electron background subtraction • Composition estimates based on Ne/Ni differences • S/C potential estimates of density • More accurate dead-time corrections for solar wind ions