Download
1 / 34
350 likes | 373 Vues
Learn about the FMSP Stock Assessment Guide's role, tools, and importance in fishery management. This guide explores stock assessment concepts, methods, and advice for effective fisheries management. Discover key questions and inputs essential for strategic stock assessment.

E N D
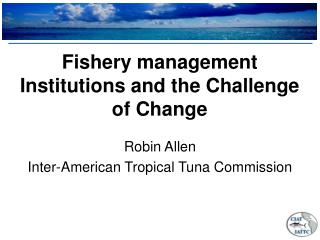
Promotion of the FMSP Fishery Management and Stock Assessment Guides Part 2. The ‘Stock Assessment Guide’ Presented at: CRFM 2nd Annual Science Conference Trinidad and Tobago, March 2006 By Dan Hoggarth, Scales Consulting Ltd
Reminder…. • Two part set from project R8468: I. How to manage a fishery – A simple guide to writing a fishery management plan (the ‘Managers’ Guide’) II. A guide to fisheries stock assessment using the FMSP tools • More detailed technical guide from project R8360: • FAO Fisheries Technical Paper 487. Stock assessment for Fishery Management. A framework guide to the use of the FMSP stock assessment tools. • More details on stock assessments and models also available in software help files
The ‘SA’ Guide - Table of Contents • Preface • 1 What is the role of stock assessment in fishery management? • 2 What is a stock assessment? • 3 What tools can I use to make a stock assessment? • 4 How do I select the best tool for the job? • 5 How should I provide stock assessment advice to managers? • 6 References • Annexes • Annex 1. A checklist for fisheries scientists • Annex 2. Glossary of terms • Annex 3. The analytical approach to stock assessment using LFDA and Yield • Annex 2. The biomass dynamic approach to stock assessment using CEDA • Annex 3. Using the ParFish tool in data-limited situations and co-management
1. What is the role of Stock Assessment in fishery management? • 1.1 Providing advice in the preparatory phase • Identifying unit stock etc • 1.2 Helping develop (and review) the management plan • Suggesting indicators and reference points • Strategic advice on alternative management options • Estimating uncertainty and advising on control rule options • 1.3 Fine tuning in the implementation phase • Tactical advice (e.g. annually) on year-to-year adjustments in the management measures
Stock assessment inputs over time • Tactical assessments (short term advice) to monitor the fishery indicators and adjust management controls as needed, say every 1-2 years • Preparing for management planning (situation analysis, identify unit stock etc) • Full strategic assessments to develop the plan and then for reviews say every 3-5 years in future (long term advice) Years: 2006 2009 2012 ‘07 ‘08 ‘10 ‘11 ‘13 ‘14 Sections 1.1-1.3
2. What is a stock assessment? • A full strategic ‘SA’ should answer three key questions: • "Where would we like to be?" - the values of specific reference points selected by managers, as estimated for that fishery, updated for any new data (e.g. the actual value of F that would give MSY). • "Where are we now, relative to where we would like to be?" - an assessment of the current status of the fishery as given by the indicators (e.g. the estimate of Fnow). • "What are the implications of alternative management scenarios, including doing nothing?" - estimates of the effect on each indicator of those management measures or controls identified as feasible for the fishery.
What is involved in a stock assessment? • NB: • Full stock assessments require both indicators & reference points • Intermediate parameters are only steps towards the real needs
Data / Inputs • Catch, effort and abundance data • Size compositions (catch at age and length frequency data) • Biological data (sex, size at maturity, etc) • Other data: Social, economic, indigenous knowledge, etc • Intermediate parameters • Used in models to estimate indicators and reference points, e.g.: • Individual fish growth rates (K, L∞) • Population growth rate (r) and carrying capacity (K) • Natural mortality (M), maturity and reproduction (Lm50) • Gear selectivity (e.g. Lc50), Catchability (q) • Stock recruitment relationship • Assessment • tools • FMSP software • LFDA • Yield • CEDA • ParFish Other FMSP tools/guidelines • Age based methods • B&H invariant methods • Multi-species guidelines • Bayesian approaches • Empirical approaches • Other tools • FiSAT • VPA • BEAM4, etc • Fishery Indicators • Catch, effort (Cnow, fnow) • CPUE, Stock size (Bnow) • Fishing mortality rate (Fnow) • Others (social, economic, ecological, governance etc) • Reference Points • MSY-based (FMSY, BMSY) • Proxies for MSY (e.g. F0.1) • For maintaining reproductive capacity (e.g. F%SSB, F%SPR) • Risk-defined (e.g. Ftransient) • Multispecies and eco-system based • Economic and social • Management advice • Comparison of fishery indicators and reference points to provide management advice allowing for uncertainty and risk • Feedback for control rule management • Management projections (short-term and long-term advice) • Recognising multiple objectives and management options Example Stock Assessment Elements Section 2.1 (and see FAO FTP 487)
2.2 Are there alternative approaches to stock assessment? • Yes…. • Analytical / dynamic pool approach • (see e.g. Annex 3 - using LFDA and Yield software) • Biomass dynamic approach • (see e.g. Annex 4 - using CEDA software) • ParFish approach (see Annex 5) • And many other alternative approaches, software, models...
Biomass dynamic or analytical? • Biomass dynamic models like Schaefer surplus production model used in CEDA and ParFish • relate fishery outputs (catch) directly to inputs (effort) • useful where fish are hard to age – used to set quotas and effort • Analytical models used in ‘Yield’ and other ‘per recruit’ and dynamic pool approaches • include intermediary processes, both biological and fishery (e.g. from LFDA) • may be length-based or age-based • needed for management advice on size limits, seasons etc • Neither approach is more right or wrong than the other – they are just based on different models and assumptions Boxes 4 & 5, Table 7
What tools can I use to make a stock assessment? • FMSP software tools: • Length Frequency Distribution Analysis (LFDA) see Box 8 • Yield see Box 9 • Catch Effort Data Analysis (CEDA) see Box 10 • Participatory Fisheries Stock Assessment (ParFish) see Box 11 • and many others • See FAO Fish. Tech. Paper 487 for details
3.1 What do the different FMSP stock assessment tools estimate? (Table 5)
3.2 So what type of stock assessments can I use the different tools for? • Options for strategic stock assessments of the long-term effects of alternative management measures (Table 6)
3.2 And for short term tactical assessments… • At this stage, you just need to re-estimate your selected indicators to see if you are meeting your targets or avoiding your limits (e.g. every 1-2 years) • As shown in Table 5…... • If you are using Biomass-based reference points, use CEDA or ParFish • If you are using F-based reference points, use LFDA or other (VPA)
4. How do I select the best tool for the job? • Step 1. What tools could provide advice about the management controls and standards (indicators and reference points) selected for the fishery? • See Tables 5 and 6 as above • Note that several tools might be suitable, so... • Step 2. Of the tools and approaches available, what is the most appropriate to the local situation? • See Tables 7 and 8 to help decide • See also Box 13 and Table 9 for process….
5. How should I provide stock assessment advice to managers? • 5.1 Providing strategic advice on alternative management options • 5.2 Providing tactical advice to guide management by the control rules • 5.3 Making projections: how long will it take to achieve the results? • 5.4 How should I present the uncertainty in my analysis? • 5.5 Giving advice in terms of risk
5.1 Providing strategic advice on alternative management options • Remember, full strategic SA report should cover: • "Where would we like to be?" - the values of specific reference points selected by managers, as estimated for that fishery, updated for any new data (e.g. the actual value of F that would give MSY, e.g. FMSY = 0.4). • "Where are we now, relative to where we would like to be?" - an assessment of the current status of the fishery as given by the indicators (e.g. the estimate of Fnow). • "What are the implications of alternative management scenarios, including doing nothing?" - estimates of the effect on each indicator of those management measures or controls identified as feasible for the fishery.
Providing strategic advice…. • Use graphs or decision tables to show the trade-offs between the different objectives • Graphs nice when only two objectives, e.g. here • Add lines or symbols to show current position on curves YPR reference points, e.g. F0.1, where slope of YPR curve is 10% of that at the origin SSBPR reference points, e.g. F20%SPR, where SSBPR is 20% of its unfished level
Or use decision tables when more objectives to consider... • E.g. here from box 14 (could add more rows or columns…)
5.2 Providing tactical advice to guide management by the control rules e.g. mark position of Fnow and Bnow and show action required Flim Fpa Fishing mortality rate to be allowed next year Blim Bpa Stock size this year
5.3 Making projections • 1. Show how long it will take to achieve results • 2. Allow for the fact that current biomass might be below optimum or target levels • (gives the basis of rebuilding plans for overexploited fisheries). • Can use Yield or CEDA software.
5.4 How should I present the uncertainty in my analysis? • See boxes etc to illustrate use of confidence intervals, histograms of parameter estimates, and sensitivity tests • Uncertainty can be used to adjust management advice to give ‘precautionary’ reference points, but…. • … remember that the manager needs to decide what level of precaution is appropriate (not the SA advisor), e.g. following discussions with stakeholders
Outputs from ‘Yield’ showing uncertainty in results given as histograms
5.5 Giving advice in terms of risk • Risk is formally defined as the probability of something bad or undesirable happening • Risk assessment is one of the foundations of the precautionary approach, and required by the FAO Code of Conduct for Responsible Fisheries • You can provide advice in simple ways • e.g. by clarifying the risks of alternative reference points • or by showing confidence intervals or distributions • or more explicitly • e.g. using Yield’s Ftransient reference point (see Boxes 19 and 25)
Analytical models Bayesian approach Beverton and Holt ‘invariant’ method Biomass dynamic models Carrying Capacity CEDA Decision control rules Decision tables Depletion models Empirical models FiSAT Fishing mortality rate, F FMSP Growth overfishing Indicator Intermediate parameters LFDA Limit reference point Management measures Management strategy Management standards Mortality rates (see also fishing mortality rate) Objectives ParFish ‘Per recruit’ indicators and ref. points Precautionary approach Precautionary reference point Production Model Projection Recruitment overfishing Reference point Risk Scenario Sensitivity analysis SPR / SSBPR Stock assessment (SA) Stock assessment (SA) tools Strategic stock assessments Tactical stock assessments Target reference point Technical reference points Uncertainty Unit stock Virtual Population Analysis (VPA) von Bertalanffy growth function (VBGF) ‘Yield’ Annex 2. Glossary of terms
Annexes 3-5. Example Stock Assessment Approaches • Annex 1. The analytical approach to stock assessment using LFDA and Yield • Annex 2. The biomass dynamic approach to stock assessment using CEDA • Annex 3. Using the ParFish tool in data-limited situations and co-management • These are not complete demonstrations of the software capabilities, nor show all the options • But given as examples of how a SA could be carried out, and what advice could be provided by each tool
The analytical stock assessment approach using LFDA and Yield Length frequency data Biological data, management controls (size limits, closed seasons etc) Data / inputs Assessment tools LFDA Yield Intermediate parameters L∞, K, t0 (growth) Indicators Z ( - M ) Fnow(Eq) Per recruit Fmax F0.1 F%SPR With SRR FMSY Ftransient Reference points Management advice Compare to make management advice on F e.g. if Fnow > FMSY, reduce F by management controls if Fnow < FMSY, OK Annex 3
‘per recruit’ or with recruitment? • Including recruitment in analytical models completely changes results • But stock-recruit relationship expensive to get • So, if using per-recruit models, give first priority to LRPs for biomass per recruit Box 24
Age-based or length-based? • ELEFAN, FiSAT II etc largely promoted length-based methods for tropical fisheries. FMSP LFDA software also length-based • Four FMSP projects, however, have confirmed the benefits of age-based approaches, wherever fish can be aged (e.g. using otolith readings) – more accurate etc • Age-based methods now used for deep slope snapper fisheries in FMSP study sites in Seychelles • Length-based methods better where fish really can not be aged (e.g. crustacea), or where ageing is v. expensive Table 7
The CEDA stock assessment approach (biomass dynamic model) Catch / effort time series Current catch / effort data Data / inputs Assessment tools CEDA Intermediate parameters r, K, q Bnow fnowCnow Indicators Reference points BMSY fMSY MSY Management advice Compare to make management advice on effort or catches Annex 4
The ParFish stock assessment approach Catch / effort time series Stock assess’t interview data or other priors Preference interview data Current catch / effort data Data / inputs Assessment tools ParFish ParFish Intermediate parameters r, K, q Bnow fnowCnow Indicators Reference points flim Clim fopt Copt Management advice on effort or catch controls, in terms of limit and target levels. Targets (fopt,Copt) incorporate the preferences of resource users. Limits are based on the risk that B will be reduced below a specified % of K. Management advice Annex 5