Download
1 / 26
260 likes | 403 Vues
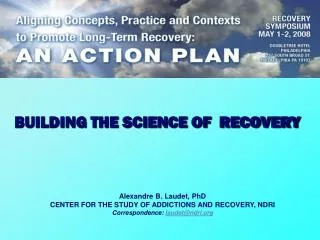
The Science of Recovery Management. Michael L. Dennis, Ph.D. Chestnut Health Systems 720 W. Chestnut, Bloomington, IL 61701, USA E-mail: mdennis@chestnut.org

E N D
The Science ofRecovery Management Michael L. Dennis, Ph.D. Chestnut Health Systems 720 W. Chestnut, Bloomington, IL 61701, USA E-mail: mdennis@chestnut.org Presentation at “2007 National Association of Addiction Treatment Providers (NAATP) Conference”, May 20-23, 2007, San Diego, CA. The opinions are those of the authors and do not reflect official positions of the association or government. Available on line at www.chestnut.org/LI/Posters or by contacting Joan Unsicker at 720 West Chestnut, Bloomington, IL 61701, phone: (309) 827-6026, fax: (309) 829-4661, e-Mail: junsicker@Chestnut.Org. This presentation was supported by funds from NIDA grant no. R37-DA11323, and R01 DA15523 and SAMHSA/CSAT contract no. 270-2003-00006 . The opinions are those of the authors do not reflect official positions of the government or ATTCs. Please address comments or questions to the author at mdennis@chestnut.org or 309-820-3805. A copy of these slides will be posted at www.chestnut.org/li/posters and the conference website .
Problem and Purpose Over the past several decades there has been a growing recognition that a subset of substance users suffers from a chronic condition that requires multiple episodes of care over several years. This presentation will present • Epidemiological data to quantifying the chronic nature of substance disorders and how it relates to a broader understanding of recovery • The results of two experiments designed to improve the ways in which recovery is managed across time and multiple episodes of care.
Severity of Past Year Substance Use/Disorders (2002 U.S. Household Population age 12+= 235,143,246) Dependence 5% Abuse 4% No Alcohol or Regular AOD Drug Use 32% Use 8% Any Infrequent Drug Use 4% Light Alcohol Use Only 47% Source: 2002 NSDUH and Dennis & Scott under review
Adolescent Onset Remission Problems Vary by Age NSDUH Age Groups Increasing rate of non-users 100 Severity Category 90 No Alcohol or Drug Use 80 70 Light Alcohol Use Only 60 Any Infrequent Drug Use 50 40 Regular AOD Use 30 Abuse 20 10 Dependence 0 65+ 12-13 14-15 16-17 18-20 21-29 30-34 35-49 50-64 Source: 2002 NSDUH and Dennis & Scott under review
Mean (95% CI) $3,058 This includes people who are in recovery, elderly, or do not use because of health problems Higher Costs $1,613 $1,528 $1,309 $1,078 $948 Higher Severity is Associated with Higher Annual Cost to Society Per Person $4,000 Median (50th percentile) $3,500 $3,000 $2,500 $2,000 $1,500 $1,000 $725 $406 $500 $231 $231 $0 $0 $0 No Alcohol or Light Alcohol Regular AOD Any Dependence Abuse Infrequent Drug Use Use Only Drug Use Use Source: 2002 NSDUH and Dennis & Scott under review
The Majority Stay in Tx Less than 90 days 90 60 52 42 Median Length of Stay in Days 33 30 20 0 Outpatient Intensive Short Term Long Term Outpatient Residential Residential Level of Care Source: Data received through August 4, 2004 from 23 States (CA, CO, GA, HI, IA, IL, KS, MA, MD, ME, MI, MN, MO, MT, NE, NJ, OH, OK, RI, SC, TX, UT, WY) as reported in Office of Applied Studies (OAS; 2005). Treatment Episode Data Set (TEDS): 2002. Discharges from Substance Abuse Treatment Services, DASIS Series: S-25, DHHS Publication No. (SMA) 04-3967, Rockville, MD: Substance Abuse and Mental Health Services Administration. Retrieved from http://wwwdasis.samhsa.gov/teds02/2002_teds_rpt_d.pdf .
Less Than Half Are Positively Discharged 100% 90% Other 80% 70% Terminated 60% Discharge Status Dropped out 50% 40% Completed 30% 20% Transferred 10% 0% Less than 10% are transferred Outpatient Intensive Short Term Long Term Outpatient Residential Residential Level of Care Source: Data received through August 4, 2004 from 23 States (CA, CO, GA, HI, IA, IL, KS, MA, MD, ME, MI, MN, MO, MT, NE, NJ, OH, OK, RI, SC, TX, UT, WY) as reported in Office of Applied Studies (OAS; 2005). Treatment Episode Data Set (TEDS): 2002. Discharges from Substance Abuse Treatment Services, DASIS Series: S-25, DHHS Publication No. (SMA) 04-3967, Rockville, MD: Substance Abuse and Mental Health Services Administration. Retrieved from http://wwwdasis.samhsa.gov/teds02/2002_teds_rpt_d.pdf .
Multiple Co-occurring Problems are Correlated with Severity and Contribute to Chronicity Adolescents More likely to have externalizing disorders 100% 100% 40% 60% 80% 20% 20% 40% 60% 80% 0% 0% Health Distress Internal Disorders Adults more likely to have internalizing disorders[ External Disorders Crime/Violence Criminal Justice System Involvement Adults Adolescents Exception Dependent (n=1221) Dependent (n=3135) Abuse/Other (n=385) Abuse/Other (n=2617) Source: GAIN Coordinating Center Data Set
Substance Use Careers Last for Decades 100% 90% 80% Percent in Recovery 70% Median duration of 27 years (IQR: 18 to 30+) Years from first use to 1+ years abstinence 60% 50% 40% 30% 20% 10% 0% 0 5 10 15 20 25 30 Source: Dennis et al 2005 (n=1,271)
Substance Use Careers are Longer, the Younger the Age of First Use 100% 90% 21+ 80% Percent in Recovery 15-20* Age of 1st Use Groups 70% Years from first use to 1+ years abstinence 60% under 15* 50% 40% 30% 20% * p<.05 (different from 21+) 10% 0% 0 5 10 15 20 25 30 Source: Dennis et al 2005 (n=1,271)
Substance Use Careers are Shorter the Sooner People get to Treatment 100% 0-9* 90% 80% 10-19* Years to 1st Tx Groups Percent in Recovery 70% Years from first use to 1+ years abstinence 60% 50% 40% 20+ 30% 20% 10% * p<.05 (different from 20+) 0% 0 5 10 15 20 25 30 Source: Dennis et al 2005 (n=1,271)
It Takes Decades and Multiple Episodes of Treatment 100% 90% 80% Percent in Recovery 70% Median duration of 9 years (IQR: 3 to 23) and 3 to 4 episodes of care Years from first Tx to 1+ years abstinence 60% 50% 40% 30% 20% 10% 0% 0 5 10 15 20 25 Source: Dennis et al 2005 (n=1,271)
The Cyclical Course of Relapse, Incarceration, Treatment and Recovery: Adults P not the same in both directions 6% 7% 25% 30% 8% 13% 29% 4% 7% 44% 31% 28% Treatment is the most likely path to recovery Over half change status annually Incarcerated (37% stable) In the In Recovery Community (58% stable) Using (53% stable) In Treatment (21% stable) Source: Scott et al 2005
Predictors of Change Also Vary by Direction • Probability of Transitioning from Using to Abstinence • mental distress (0.88) + older at first use (1.12) • ASI legal composite (0.84) + homelessness (1.27) • + # of sober friend (1.23) • + per 8 weeks in treatment (1.14) In the 13% In Recovery Community (58% stable) Using 29% (53% stable) Probability of Relapsing from Abstinence + times in treatment (1.21) - Female (0.58) + homelessness (1.64) - ASI legal composite(0.84) + number of arrests (1.12) - # of sober friend (0.82) - per 77 self help sessions (0.55) Source: Scott et al 2005
1-3 Years: Decrease in Illegal Activity; Increase in Psych Problems 5-8 Years: Improved Psychological Status 3-5 Years: Improved Vocational and Financial Status 1-12 Months: Immediate increase in clean and sober friend % of Clean and Sober Friens % Days of Illegal Activity (of 30 days) % Days Worked For Pay (of 22) % Days of Psych Prob (of 30 days) % Above Poverty Line Other Aspects of Recovery by Duration of Abstinence of 8 Years 100% 90% 80% 70% 60% 50% 40% 30% 20% 10% 0% Using 1 to 12 ms 1 to 3 yrs 3 to 5 yrs 5 to 8 yrs (N=661) (N=232) (N=127) (N=65) (N=77) Source: Dennis, Foss & Scott (under review)
Percent Sustaining Abstinence Through Year 8 by Duration of Abstinence at Year 7 Even after 3 to 7 years of abstinence about 14% relapse 100% . 86% 86% 90% It takes a year of abstinence before less than half relapse 80% 66% 70% 60% % Sustaining Abstinent through Year 8 50% 36% 40% 30% 20% 10% 0% 1 to 12 months 1 to 3 years 3 to 5 years 5+ years (n=157; OR=1.0) (n=138; OR=3.4) (n=59; OR=11.2) (n=96; OR=11.2) Duration of Abstinence at Year 7 Source: Dennis, Foss & Scott (under review)
The Cyclical Course of Relapse, Incarceration, Treatment and Recovery: Adolescents More likely to be diverted to treatment (OR=4.0) More likely to relapse (OR=1.4 to 1.8) 10% 20% 24% Treatment is still the most likely path to recovery Incarcerated 3% (46% stable) 5% In the 12% In Recovery Community (62% stable) Using 27% (75% stable) 7 % 7% 19% 26% 7% In Treatment Avg of 39% change status each quarter (48% stable) Source: 2006 CSAT AT data set
The Cyclical Course of Relapse, Incarceration, Treatment and Recovery: Adolescents • Probability of Transitioning to Recovery • Age (0.8) • Freq. Of Use (0.23) • + Female (1.7), • + Non-White (1.6) • + Self efficacy to resist relapse (1.4) • + Sub. Abuse Tx Index (1.96) Probability of Transitioning to Tx - Age (0.7) +Weeks in Cont. Environ. (1.4) + Times urine tested (1.7) + Treatment Motivation (1.6) In the 12% In Recovery Community (62% stable) Using (75% stable) 19% 7% In Treatment (48 v 35% stable) Source: 2006 CSAT AT data set
Recovery Management Checkups (RMC) in both ERI 1 & 2 included: • Quarterly Screening to determining “Eligibility” and “Need” • Linkage meeting/motivational interviewing to: • provide personalized feedback to participants about their substance use and related problems, • help the participant recognize the problem and consider returning to treatment, • address existing barriers to treatment, and • schedule an assessment. • Linkage assistance • reminder calls and rescheduling • Transportation and being escorted as needed
100% The size of the effect is growing every quarter 90% 80% 70% 630-246 = -384 days 60% 50% 40% 30% 20% 10% 0% 630 270 360 450 540 180 90 0 ERI-2 Time to Treatment Re-Entry Percent Readmitted 1+ Times (n=221) 55% ERI-2 RMC* 37% ERI-2 OM (n=224) *Cohen's d=+0.41 Wilcoxon-Gehen Statistic (df=1) =16.56, p <.0001 Days to Re-Admission (from 3 month interview)
Significant Increase in Abstinence ERI-2: Impact on Outcomes Months 4-24 Final Interview 100% RMC 90% OM RMC Broke the Run 76% 76% 80% Less Likely to be in Need of Treatment 68% 68% 70% 57% 60% Less Symptoms 49% Percentage 46% 50% 37% 40% 27% 30% 19% 20% 10% 0% of 630 Days of 7 Subsequent of 90 Days of 11 Sx of Still in need of Tx Abstinent Quarters in Need Abstinent Abuse/Dependence (d=0.29)* (d= -0.32) * (d= 0.23)* (d= -0.23)* (d= -0.24) * * p<.05
Again the Probability of Entering Recovery is Higher from Treatment Impact on Primary Pathways to Recovery (incarceration not shown) 32% Changed Status in an Average Quarter • Transition to Recov. • Freq. of Use (0.7) • Dep/Abs Prob (0.7) • Recovery Env. (0.8) • Access Barriers (0.8) • + Prob. Orient. (1.3) • + Self Efficacy (1.2) • + Self Help Hist (1.2) • + per 10 wks Tx (1.2) 17% 18% In the Community y In Recovery Using (76% stable) (71% stable) 27% 8% 33% 5% • Transition to Tx • Freq. of Use (0.7) • + Prob. Orient. (1.4) • + Desire for Help (1.6) • + RMC (3.22) In Treatment (35% stable) Source: ERI experiments (Scott, Dennis, & Foss, 2005)
Post Script on ERI experiments • Again, severity was inversely related to returning to treatment on your own and treatment was the key predictor of transitioning to recovery • The ERI experiments demonstrate that the cycle of relapse, treatment re-entry and recovery can be shortened through more proactive intervention • Working to ensure identification, showing to treatment, and engagement for at least 14 days upon readmission helped to improve outcomes • ERI 2 also demonstrated the value of on-site proactive urine testing versus the traditional practice of sending off urine for post interview testing
These studies provide converging evidence demonstrating that • substance use disorders are often chronic in the sense that they last for years and the risk of relapse is high • the majority of people accessing publicly funded substance abuse treatment have been in treatment before, are likely to return, have a variety of co-occurring problems and may need several additional episodes of care before they reach a point of stable recovery. • Yet over half do make it to recovery and the odds of getting to and staying in recovery can be improved with proactive management. • Though we did not have time to go over them today, similar studies and findings are coming out with adolescents and young adults
We need to.. • Educate policy makers, staff and clients to have more realistic expectations • Redefine the continuum of care to include monitoring and other proactive interventions between primary episodes of care. • Shift our focus from intake matching to on-going monitoring, matching over time, and strategies that take the cycle into account • Identify other venues (e.g., jails, emergency rooms) where recovery management can be initiated • Evaluate the costs and determine generalizability to other populations through replication • Explore changes in funding, licensure and accreditation to accommodate and encourage above
Sources and Related Work • American Psychiatric Association. (2000). Diagnostic and statistical manual of mental disorders (DSM-IV-TR) (4th - text revision ed.). Washington, DC: American Psychiatric Association. • Chan, Y.-F., Dennis, M. L., & Funk, R. (in press). Prevalence and comorbidity of major internalizing and externalizing problems among adolescents and adults presenting to substance abuse treatment. Journal of Substance Abuse Treatment. • Dennis, M.L., Chan, Y.-F., & Funk, R. (2006). Development and validation of the GAIN Short Screener (GSS) for psychopathology and crime/violence among adolescents and adults. American Journal on Addictions, 15, 80-91. • Dennis, M.L., Foss, M.A., & Scott, C.K (under review). Correlates of Long-Term Recovery After Treatment. Evaluation Review. • Dennis, M. L., Scott, C. K. (in press). Managing substance use disorders (SUD) as a chronic condition. NIDA Science and Perspectives. • Dennis, M. L., Scott, C. K., Funk, R., & Foss, M. A. (2005). The duration and correlates of addiction and treatment careers. Journal of Substance Abuse Treatment, 28, S51-S62. • Dennis, M. L., Scott, C. K., & Funk, R. (2003). An experimental evaluation of recovery management checkups (RMC) for people with chronic substance use disorders. Evaluation and Program Planning, 26(3), 339-352. • Epstein, J. F. (2002). Substance dependence, abuse and treatment: Findings from the 2000 National Household Survey on Drug Abuse (NHSDA Series A-16, DHHS Publication No. SMA 02-3642). Rockville, MD: Substance Abuse and Mental Health Services Administration, Office of Applied Studies. Retrieved from http://www.DrugAbuseStatistics.SAMHSA.gov. • GAIN Coordinating Center Data Set (2005). Bloomington, IL: Chestnut Health Systems. See www.chestnut.org/li/gain . • Kessler, R. C., Nelson, G. B., McGonagle, K. A., Edlund, M. J., Frank, R. G., & Leaf, P. J. (1996). The epidemiology of co-occurring mental disorders and substance use disorders in the national comorbidity survey: Implications for prevention and services utilization. Journal of Orthopsychiatry, 66, 17-31. • Office Applied Studies (2002). Analysis of the 2002 National Survey on Drug Use and Health (NSDUH) on line at http://webapp.icpsr.umich.edu/cocoon/ICPSR-SERIES/00064.xml . • Office Applied Studies (2002). Analysis of the 2002 Treatment Episode Data Set (TEDS) on line data at http://webapp.icpsr.umich.edu/cocoon/ICPSR-SERIES/00056.xml) • Scott, C. K., & Dennis, M. L. (under review). Results from Two Randomized Clinical Trials evaluating the impact of Quarterly Recovery Management Checkups with Adult Chronic Substance Users. Addiction. • Scott, C. K., Dennis, M. L., & Foss, M. A. (2005). Utilizing recovery management checkups to shorten the cycle of relapse, treatment re-entry, and recovery. Drug and Alcohol Dependence, 78, 325-338. • Scott, C. K., Foss, M. A., & Dennis, M. L. (2005). Pathways in the relapse, treatment, and recovery cycle over three years. Journal of Substance Abuse Treatment, 28, S61-S70. • World Health Organization (WHO). (1999). The International Statistical Classification of Diseases and Related Health Problems, tenth revision (ICD-10). Geneva, Switzerland: World Health Organization. Retrieved from www.who.int/whosis/icd10/index.html.