Using Root Cause Analysis to Choose Interventions
Using Root Cause Analysis to Choose Interventions. Robert Frantum-Allen, MA Colorado League of Charter Schools August 2014. Intro and Norms. The Trouble with Handouts . http://rcause.wikispaces.com. Paper on Specially Designed Instruction and Root Cause Analysis Today’s Presentation


Using Root Cause Analysis to Choose Interventions
E N D
Presentation Transcript
Using Root Cause Analysis to Choose Interventions Robert Frantum-Allen, MA Colorado League of Charter Schools August 2014
The Trouble with Handouts http://rcause.wikispaces.com • Paper on Specially Designed Instruction and Root Cause Analysis • Today’s Presentation • Sample Root Cause Analysis in Reading on 6 students • Blank Templates for Root Cause Analysis
Body of Evidence • Researched Diets- found a company that does something very unique and was intrigued right away…
Progress Monitored Average Weekly Blood Pressure
Results 252 lbs 252 242 lbs 232 lbs 231 222 lbs 212 lbs 207 200 192 lbs 190 182 lbs 182 172 lbs 162 lbs 1 2 3 4 5 6
Multi-tiered System of Supports (MTSS) Integrated Continuum Academic Continuum Behavior Continuum Adapted from the OSEP TA Center for PBIS Adapted from the OSEP TA Center for PBIS
What Does This Mean for Our School? Problem solving teams are looking at the body of evidence to determine need. A problem solving team can be a data team, student intervention team, a special team that was created to address a unique need or and IEP team Problem solving teams design a plan to address the problem. The plan is implemented by the designated personnel. The problem solving teams determines if the plan was effective. If the plan was not effective, attempts to adjust the plan accordingly should be made and re-implemented.
data data data data data data data data data data constipation
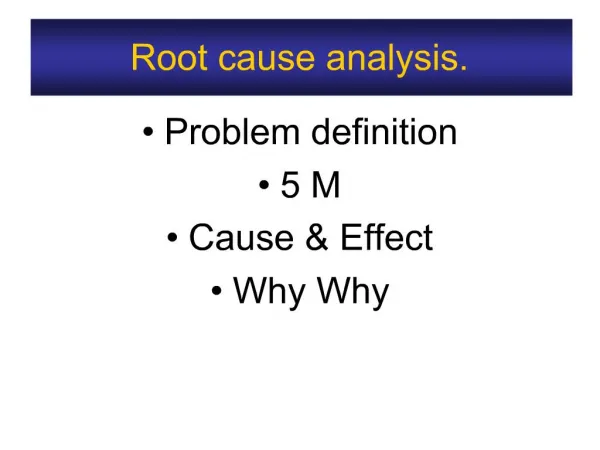
Strategies for Interpreting the Data: Five Why Analysis
5 Why Tree is used when…. … a team needs to study a problem/issue to determine the root cause. … a team wants to study all the possible reasons to determine the most logical cause and secondary causes
5 Why Analysis • My car will not start. (the problem) • Why? - The battery is dead. (first why) • Why? - The alternator is not functioning. (second why) • Why? - The alternator belt has broken. (third why) • Why? - The alternator belt was well beyond its useful service life and has never been replaced. (fourth why) • Why? - I have not been maintaining my car according to the recommended service schedule. (fifth why, a root cause) • Why? - Replacement parts are not available because of the extreme age of my vehicle. (sixth why, optional footnote) • I will start maintaining my car according to the recommended service schedule. (solution)
Problem Why Why Why Why Why Why Why Why Why Why Why Why Why Why Why
5 Why’s Analysis Tree Struggles with writing a complete paragraph Weak transcriptions skills Doesn’t consistently use the paragraph pattern Weak translation skills Handwriting is not legible Confuses the parts of a paragraph Uses incomplete sentences Follows oral language syntax Writes from bottom up and reverses letters Struggles with focus during instruction Doesn’t know written subject predicate rules Never received handwriting instruction Has ADHD
Fishbone diagram is used when…. … a team needs to study a problem/issue to determine the root cause. … a team wants to study all the possible reasons why a process is beginning to have difficulties, problems, or breakdowns. … a team needs to identify areas for data collection. … a team wants to study why a process is not performing properly or producing the designed results.
3) Label each bone with categories to be studied 2) List the problem in the head of the fish 4) Identify the factors within each category that maybe affecting the problem 1) Draw the fishbone diagram 5) Continue until you no longer get useful information 6) Analyze the results
Phonological Awareness Alphabetic Principle What sources of data do we currently have for each of these categories? Reading Vocabulary and Comprehension Fluency
Strategies for Interpreting the Data: Pareto Analysis Vilfredo Pareto Joseph Juran
Pareto Principal • 80% of Effects are instigated by 20% of causes.
Specific Learning Disability • Definition: Specific Learning Disability means a disorder in one or more of the basic psychological processes involved in understanding or in using language, spoken or written, that may manifest itself in the imperfect ability to listen, think, speak, read, write, spell or do mathematical calculations, including conditions such as perceptual disabilities, brain injury, minimal brain dysfunction, dyslexia, and developmental aphasia.
Cognitive Sweat • She had a largepiece of birthday cake. • I would love to have a slice of cake. • The first slice was very little. • Is there a chance I could talk to the person in charge? • The housemouse also likes to eat cake. • Whereare you going with that cake?
Why is there a silent e? 1. Cake, Slice 2. Love, Have 3. Large, Piece, Charge, Chance, Slice 4. Little 5. House, Mouse 6. Where, Are
Reasoning VERBAL NONVERBAL
Reading Processors context run semantic /r/ /ŭ/ /n/ orthographic phonologic
Brain Images Comparing 9-Year-Old Average Reader and 9-Year-Old Un-remediated Poor Reader
Changes in Brain Activation Patterns in Response to Instruction p. 63
Processing Speed rapid retrieval accuracy
Phonological Awareness Alphabetic Principle Reading Vocabulary and Comprehension Fluency
Handwriting/ Keyboarding Spelling Writing Composition Grammar