Download
1 / 24
240 likes | 446 Vues
Digital Literacy Projects at Academy of Urban Planning. May 12 th , 2010. Academy of Urban Planning. AUP is located in Bushwick, Brooklyn AUP first opened in 2003. At the moment it has about 475 students Our fourth class will graduate this year. Urban Planning as a High School Theme.

E N D
Digital Literacy Projects at Academy of Urban Planning May 12th, 2010
Academy of Urban Planning • AUP is located in Bushwick, Brooklyn • AUP first opened in 2003. At the moment it has about 475 students • Our fourth class will graduate this year
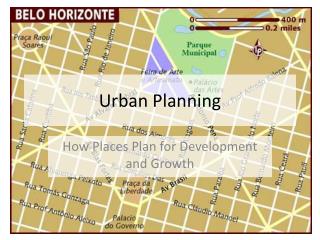
Urban Planning as a High School Theme Our school’s mission • …The urban planning, theme-based curriculum draws students out of the classroom and into their communities to develop skills that will move them towards HIGHER EDUCATION and CAREERS, while at the same time tapping into their innate curiosity for the world around them.
Urban Planning and Technology Coursework • Senior Seminar in Urban Planning • Urban Geography / Geographic Information Sciences • Introduction and Advanced Graphic Design • Urban Ecology
Geographic Information Systems • Only full time GIS class in New York City (hopefully that will change!) • Partner with ESRI (www.edcommunity.esri.com) • Explosion of available data and software
GIS Software • Google Earth • Arcgis Explorer Java Edition for Education (AEJEE) - free download • Arcgis Explorer 900 (like Google Earth) – free download • ArcGIS – full featured GIS
GIS Projects at AUP • Scaffolded approach • Online Mapping • AEJEE • Arcgis Explorer • ArcGIS
Environmental Justice Project 2009 - 2010 • Collaboration of Urban Ecology and GIS Class • Data from NYC Data Mine and other Public Sources
Cancer rates along Newtown CreekRaquel Nunez ,Angelique Torres,MerquicedecPeralta,AneuryColladoTania Spina,WilsonBarbecho ,Gerardo SantanaAcademy of Urban Planning400 Irving Street, Brooklyn, New York • Conclusion • Base on the maps cancer rates around Newtown creek seem to be lower than expected. The one exception seems to be colorectal cancer which shows to be higher around Newtown creek. We needed to do more research to determine if the Newtown creek pollution is contributing to high colorectal cancer rates. • Our research question is: Are the cancer rates along Newtown Creek evenly distributed over the whole area? This question is important to us because most of the students in AUP live around that area. While Newtown creek has gotten cleaner over the past few years, you can also say that it has gotten worse when you are talking about certain cancers. It relates to environmental justice because people in this area are subject to an environment that’s harming them. What we already know about Newtown creek is that it is one of the most polluted bodies of water in NYC. • Acknowledgements • Thank you Kim and Adam for your help on this project. Also we would like to thanks Mr.Lapidus and Mr. Schwartz for teaching us how to make maps and Ms. Ceraldi for teaching us about Newtown Creek. • We used the information from the New York State Department of Health to help us find the number of cancer cases in the area by zip codes. We also used Arc Map to map the different types of cancer that were in the area of new town creek. • We also used Arc Map to map where all of the students that go to AUP live. This lets us know if they live in a high cancer area or low cancer area. • Results • lung and colorectal cancers are found in areas around the creek to have 15 to 49% above expected cancer rate. • Breast and prostate cancers are found in areas around the creek to be within 15% or 15 to 50% below expected cancer rate. Heimbinder, Michael. "Habitat map". 04/08/10 "cancer incidents by zip code". new York state department of health. 04/08/10 BROOKLYN ZIP CODE MAP. UNHP. <http://www.unhp.org/crg/indy-maps-bkzip.html>.
Jellyfish Blooms and CSO’sGlendaly Corona , ChavelyReynoso, Oscar RiveraAcademy of Urban Planning400 Irving Street, Brooklyn, New York Research Question: Do jellyfish blooms occur more frequently near Combined Sewage Overflows (CSO’s)? Background: Within recent years there has been a surge of jellyfish blooms within the waterways surrounding New York City. Certain new species have been arriving within our area and many of which threaten the lives of bathers. CSO’s are located throughout the waterways of New York City. Jellyfish are known to flourish in areas where the waters are more polluted. Within our investigations we looked into areas of greatest CSO output and probability of jellyfish blooms therein. Data Collection Methods: Collected data on CSO locals from Oasis.com Collected NOAA data sheets on New York City currents Through the use of the data from these sites we created a map through HabitiatMap.com to highlight the probably of jellyfish blooms within the New York City area. Results: According to our maps it appears that the areas of Jamaica Bay and the waterways in the area of the South Bronx have greatest risk for jellyfish blooms. The areas that appear to have a lower chance of jellyfish blooms are east of Jamaica Bay and the South Beach area of Staten Island. Conclusion: In areas of greatest CSO output, not only is the direct health threat problematic, but the probability of jellyfish blooms further perpetuates the dangers within these areas. Acknowledgements: We would like to thank Ms. Ceraldi and Mr. Schwatrz. We would also love to thank Kim Handle and Adam Johnson, our visiting scientists from the GK12 program. References Cited: HabitatMap.com Oasis.com NOAA.com
Do rats and cockroaches affect asthma rates?Sandra Bonetti, Sara and Sheila BasilioAcademy of Urban Planning400 Irving Street, Brooklyn, New York Results Area such as northern Manhattan, south Bronx, and Brooklyn show high asthma rates and infestation rates. Conclusion From our research, we found out that most cases of asthma rate are due to house violation in which rats and cockroaches are found. Abstract Do rats and cockroaches affect asthma rate? • We believe that where there are high asthma rates, rats and cockroaches are also found. Due to them being in the same area we also believe that they have an effect on asthma rates. Background • Our research question is important because it can help lower asthma rate. Over time it has gotten a little better, but it is still a problem health wise for the people living in these areas. It relates to environmental justice because areas with people with low income lack things in their environment that other areas do not. We know that areas with low income have rat and cockroaches infestations, but also asthma problems. • Acknowledgements • We would like to thank Kim, Adam, Ms. Ceraldi, Mr. Schwarts, and Mr. Lapidus for all the help and support. • References Cited • http://www.asthma.partners.org/NewFiles/BoFAChapter13.html • http://findarticles.com/p/articles/mi_m1355/is_n1_v92/ai_19468214/ • http://linkinghub.elsevier.com/retrieve/pii/0091674986903830 • https://gis.nyc.gov/doh/rip/ • http://www.nyc.gov/html/doh/html/ehs/ehscroach.shtml • http://www.nyc.gov/html/ops/downloads/pdf/_mmr/dohmh.pdf • https://gis.nyc.gov/doh/track/ • http://aje.oxfordjournals.org/cgi/reprint/148/1/78.pdf Data Collection Methods The asthma rate data was from arc map 2006 community survey data.
Why are we Complaining about The Air?Andrea Ortega, CarizmaPinney, Vanity GreenStubbs, Wendy Monroy, Elvis Almonte, Academy of Urban Planning400 Irving Street, Brooklyn, New York Conclusion Overall the percentage of carbon dioxide is high therefore we suggest having either green roof tops or more trees. There should be a ratio between the number of trees and population density along highways. This would help to decrease Co2 levels in neighborhoods, thus giving people a chance to live in a community with a cleaner supply of air. Acknowledgements The group as a whole would like to thank Mr. Schwartz and Kim for there presence and support but we would really like to thank Miss. Ceraldi, Adam, and Mr. Lapidus for there help and guidance because this process was difficult but with there help they made it easy and enjoyable. References Cited "Trees Count!". New York City Department of Parks and Recreation. March 20th-April 9th <http://www.nycgovparks.org/sub_your_park/trees_greenstreets/treescount/treecount_boroughs.php>. U.S. EPA. Air Quality Criteria for Ozone and Related Photochemical Oxidants (2006 Final). U.S. Environmental Protection Agency, Washington, DC, EPA/600/R-05/004aF-cF, 2006. "Today's Air Quality Index (AQI) Forecast for New York State ". New York State Department of Environmental Conservation. March 20th-April 9th <http://www.dec.ny.gov/cfmx/extapps/aqi/aqi_forecast.cfm?CFID=53690&CFTOKEN=85925736&jsessionid=64_QZ0qEHtGi8wS_UzuwEa_>. "Today's Air Quality Index (AQI) Forecast for New York State ". The New York City Community Air Survey. March 20th-April 9th <http://www.nyc.gov/html/doh/downloads/pdf/eode/nyccas_master_report_12_15_09.pdf>. Heimbinder, Michael . "Habitat Map". Habitat Map. March 20th-April 9th <http://habitatmap.org/>. Research Question: What is the impact trees have on air quality near highways? Background Air quality is an important aspect that can affect human health and quality of life. Urban areas have higher concentration of vehicles and pollutants, therefore the higher populations of humans living in urban area; they suffer higher rates of asthma than non-urban areas. This can also be tied to income. One can infer that there is a correlation between average income and air quality. Data Collection Methods We used websites like, www.nycgovparks.org, www.dec.ny.gov, along with many others that contained the information, and had the tree counts with air quality information. The group as a whole wanted to go on site and out on the field to grab the information, but we did not have the devices that helped that production.At first we thought we were going to have to change out topic but we found numerous sites (listed in the citation) that contained everything we needed. References Cited "Trees Count!". New York City Department of Parks and Recreation. March 20th-April 9th <http://www.nycgovparks.org/sub_your_park/trees_greenstreets/treescount/treecount_boroughs.php>. U.S. EPA. Air Quality Criteria for Ozone and Related Photochemical Oxidants (2006 Final). U.S. Environmental Protection Agency, Washington, DC, EPA/600/R-05/004aF-cF, 2006. "Today's Air Quality Index (AQI) Forecast for New York State ". New York State Department of Environmental Conservation. March 20th-April 9th <http://www.dec.ny.gov/cfmx/extapps/aqi/aqi_forecast.cfm?CFID=53690&CFTOKEN=85925736&jsessionid=64_QZ0qEHtGi8wS_UzuwEa_>. "Today's Air Quality Index (AQI) Forecast for New York State ". The New York City Community Air Survey. March 20th-April 9th <http://www.nyc.gov/html/doh/downloads/pdf/eode/nyccas_master_report_12_15_09.pdf>. Heimbinder, Michael . "Habitat Map". Habitat Map. March 20th-April 9th <http://habitatmap.org/>.
Save Ridgewood Reservoir! Kiara Rodriguez, Daniel Gonzalez, Stephanie Taylor, Denisha Fernandez, Yorklenie CruzAcademy of Urban Planning400 Irving Street, Brooklyn, New York Abstract: We inquired that there are numerous polluters in Brooklyn and Queens and not enough tress to reduce AQI levels. We also found that a historic landmark is planned to be cut down and made into basketball courts although the trees are needed to reduce air pollution! Background: Ridgewood Reservoir is located in Highland park, Brooklyn! It’s a big part of Highland park, although its been closed down there's still many ways it can be used. If they want to change such a big part of Brooklyn it should be restored, not made into basketball courts! Conclusion: It has been proventhat highly polluted areas have higher asthma rates. Therefore cutting down trees, near Ridgewood Reservoir would increase health issues because of the reservoirs location near multiple highways. Though its been proposed to cut down limit trees to make basketball courts and baseball ball courts it would be more useful to create gardens and plant new trees. Since highland park has enough basketball courts why make more? Why not create gardens. Queens and Brooklyn needs trees! ReferencesCited William C. Thompson, John F. Kennedy Jr. "A Wilderness, Lost in the City". New York Times May 29, 2008: e, Bird. "Bird Observations, Reservoir". Audubon. <http://ebird.org/ebird/GuideMe?src=changeDate&getLocations=hotspots&hotspots=L393007&parentState=US-NY&reportType=location&monthRadio=on&bMonth=01&eMonth=12&bYear=1900&eYear=2009&continue.x=38&continue.y=11&continue=Continue> Image DataCollectionMethods Results: This map shows how many trees are located in Brooklyn and parts of Ridgewood. There aren't many trees in this neighborhood although the big problem is that many of the top Polluters are in queens where there are very few trees, this can cause major pollution issues in surrounding areas. It is a really big issue because Ridgewood Reservoir isn't very far from polluted areas, of course it helps reduce pollution in the air around it. Cutting down the Reservoir as planned with decrease the number of trees that can soak up and reduce CO2 levels in Brooklyn. This map indicates that there aren't many trees or parks around a large part of polluted areas meaning we need the Reservoir and it’s trees to help lesson the air pollution Image • For this project we found major pollution sites at: • http://gis.nyc.gov/doitt/nycitymap/ • -We also found tree data using the NYC Tree Census: • http://www.nycgovparks.org/sub_your_park/trees_greenstreets/treescount/index.php • -Finally, we used ARC GIS for map making. We also • needed the internet and help from many • Teachers!
Digital Literacy Skills: Putting it all together with Mixbook • http://www.mixbook.com/photo-books/all/enviormental-justice-mixbook-4331509 • http://www.mixbook.com/photo-books/all/environmental-justice-4325908 • http://www.mixbook.com/photo-books/all/enviromental-justice-mixbook-4325896 • http://www.mixbook.com/photo-books/all/bushwick-hystory-4448006 • http://jlapidus.blogspot.com