Sensitivity Analysis
Sensitivity Analysis. Basic theory Understanding optimum solution Sensitivity analysis. Summer 2013. Introduction to Sensitivity Analysis.


Sensitivity Analysis
E N D
Presentation Transcript
Sensitivity Analysis Basic theory Understanding optimum solution Sensitivity analysis Summer 2013 LP: Sensitivity Analysis
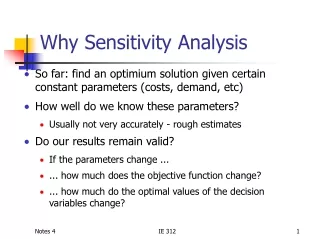
Introduction to Sensitivity Analysis • Sensitivity analysis means determining effects of changes in parameters on the solution. It is also called What if analysis, Parametric analysis, Post optimality analysis, etc,. It is not restricted to LP problems. Here is an example using Data Table. • We will now discuss LP and sensitivity analysis.. LP: Sensitivity Analysis
Primal dual relationship Consider the LP problem shown. We will call this as a “primal” problem. For every primal problem, there is always a corresponding LP problem called the “dual” problem. Note the following Min • Any one of these can be called “primal”; the other one is “dual”. • If one is of the size m x n, the other is of the size n x m. • If we solve one, we implicitly solve the other. • Optimal solutions for both have identical value for the objective function (if an optimal solution exists). optimal Max LP: Sensitivity Analysis
The Simplex Method Consider a simple two product example with three resource constraints. The feasible region is shown. We now add slack variables to each constraint to convert these in equations. Primal - dual Maximize 15 x1 + 10 x2 Minimize 800 y1 + 900 y2 + 250 y3 LP: Sensitivity Analysis
The Simplex Method: Cont… Start with the tableau for Maximize 15 x1 + 10 x2 Initial solution: Z = 0, x1 = 0, x2 = 0,S1 = 800, S2 = 900 and S3 = 250. After many iterations (moving from one corner to the next) we get the final answer. Optimal solution: Z = 6500, x1 = 300, x2 = 200 and S3 = 50. Z = 15 * 300 + 10 * 200 = 6500 Notice 7, 1, 0 in the objective row. These are the values of dual variables, called shadow prices. Minimize 800 y1 + 900 y2 + 250 y3 gives 800*7 + 900*1 + 250*0 = 6500 LP: Sensitivity Analysis
Solver “Answer Report” • Maximize 10 x1 + 8 x2 = Z • 7/10 x1 + x2 630 • 1/2 x1+ 5/6 x2 600 • x1 + 2/3 x2 708 • 1/10 x1+ 1/4 x2 135 • x1≥ 0, x2≥ 0 x1 + x2≥ 150 Consider the Golf Bag problem. Optimal solution: x1 = 540, x2= 252. Z = 7416 Binding constraints: constraints intersecting at the optimal solution. , Nonbinding constraint? , and Now consider the Solver solution. Linear Optimization
Set up the problem, click “Solve” and the box appears. If you select only “OK”, you can read values of decision variables and the objective function. Instead of selecting only “OK”, select “Answer” under Reports and then click “OK”. A new sheet called “Answer Report xx” is added to your workbook. Next slides shows the report (re-formatted). LP: Sensitivity Analysis
Answer Report The answer report has three tables: 1: Objective Cell – for the objective function 2: Variable Cells 3: for constraints. Let’s try to interpret some features.. Optimal profit Optimal variable values ? You may want to rename this Answer Report worksheet. LP: Sensitivity Analysis
Now we will consider changes in the objective function or the RHS coefficients – one coefficient at a time. Sensitivity Analysis • Maximize 10 x1 + 8 x2 = Z • 7/10 x1 + x2 630 • 1/2 x1+ 5/6 x2 600 • x1 + 2/3 x2 708 • 1/10 x1+ 1/4 x2 135 • x1 + x2≥150 • x1≥ 0, x2≥ 0 Right Hand Side (RHS). Objective function Optimal solution: x1 = 540, x2= 252. Z = 7416 Here are some questions we will try to answer. • Q1: How much the unit profit of Ace can go up or down from $8 without changing the current optimal production quantities? • Q2:What if per unit profit for Deluxe model is 12.25? Q3: What if an 10 more hours of production time is available in cutting & dyeing? inspection? LP: Sensitivity Analysis
Sensitivity Analysis • Maximize 10 x1 + 8 x2 = Z • 7/10 x1 + x2 630 • 1/2 x1+ 5/6 x2 600 • x1 + 2/3 x2 708 • 1/10 x1+ 1/4 x2 135 • x1≥ 0, x2≥ 0 x1 + x2≥ 150 Golf bags X1: Deluxe X2: Ace • Q1: How much the unit profit of Ace can go up or down from $8 without changing the current optimal production quantities? As long as the slope of the objective function isoprofit line stays within the binding constraints. LP: Sensitivity Analysis
Solver “Sensitivity Report” If you click on Sensitivity, a new worksheet, called Sensitivity Report is added. It contains two tables: Variable cells and Constraints. Variable cells table helps us answer questions related to changes in the objective function coefficients. Constraints table helps us answer questions related to changes in the RHS coefficients. We will discuss these tables separately. LP: Sensitivity Analysis
Solver “Sensitivity Report” Z = 7416 x1 = 540, x2= 252 Maximize 10 x1 + 8 x2 = Z • Q1: How much the unit profit of Ace can go up or down from $8 without changing the current optimal production quantities? • Range for X1: 10 – 4.4 to 10 + 2 • Range for X2: 8 – 1.333 to 8 + 6.286 • Try per unit profit for X2 as 14.28, 14.29, 6.67 and 6.66 Q2:What if per unit profit for Deluxe model is 12.25? Slight round off error? Reduced cost will be explained later. LP: Sensitivity Analysis
Q3: Add 10 more hours of production time for cutting & dyeing? inspection? What if questions are about the RHS? A change in RHS can change the shape of the solution space (objective function slope is not affected). • Cutting & dyeing is a binding constraint; increasing the resource will increase the solution space and move the optimal point. • Inspection is a nonbinding constraint; increasing the resource will increase the solution space and but will not move the optimal point. LP: Sensitivity Analysis
Sensitivity Report Q3 Q3: Add 10 more hours of production time for cutting & dyeing? inspection? For cutting & dyeing up to 52.36 units can be increased. Profit will increase @ $2.50 per unit. • For inspection ? Shadow price represents change in the objective function value per one-unit increase in the RHS of the constraint. In a business application, a shadow price is the maximum price that we can pay for an extra unit of a given limited resource. LP: Sensitivity Analysis
Trail Mix : sensitivity analysis Answer Report Seeds, Raisins, Flakes, Pecans, Walnuts: Min. 3/16 pounds each Total quantity = 2 lbs. Linear Optimization
Trail Mix : Cont… Interpretation of allowable increase or decrease? What is reduced cost? Also called the opportunity cost. One interpretation of the reduced cost (for the minimization problem) is the amount by which the objective function coefficient for a variable needs to decrease before that variable will exceed the lower bound (lower bound can be zero). Linear Optimization
Trail Mix : Cont…. Explain allowable increase or decrease and shadow price Linear Optimization
Example 5 Optimal: Z = 1670, X2 = 115, X4 = 100 Reduced Cost (for maximization) : the amount by which the objective function coefficient for a variable needs increase before that variable will exceed the lower bound. Shadow price represents change in the objective function value per one-unit increase in the RHS of the constraint. In a business application, a shadow price is the maximum price that we can pay for an extra unit of a given limited resource. LP: Sensitivity Analysis
Right Hand Side Objective Function Change one coefficient at a time within allowable range • The feasible region does not change. • Since constraints are not affected, decision variable values remain the same. • Objective function value will change. • Feasible region changes. • If a nonbinding constraint is changed, the solution is not affected. • If a binding constraint is changed, the same corner point remains optimal but the variable values will change. LP: Sensitivity Analysis
Miscellaneous info: • We did not consider many other topics . Example are: • Addition of a constraint. • Changing LHS coefficients. • Variables with upper bounds • Effect of round off errors. What did we learn? Solving LP may be the first step in decision making; sensitivity analysis provides what if analysis to improve decision making. LP: Sensitivity Analysis