Wolfe Island, 198 MW
220 likes | 406 Vues
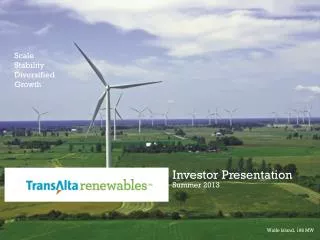
Scale Stability Diversified Growth. Investor Presentation Summer 2013. Wolfe Island, 198 MW. Forward-Looking Statements.

Wolfe Island, 198 MW
E N D
Presentation Transcript
Scale Stability Diversified Growth Investor Presentation Summer 2013 Wolfe Island, 198 MW
Forward-Looking Statements This presentation has been prepared by TransAlta Renewables Inc. (the “Company”) and the contents of this presentation are for information purposes only. This presentation does not constitute or form part of any offer or invitation to sell or issue, or any solicitation of any offer to purchase or subscribe for, any shares or other securities representing shares in the Company, nor shall it or any part of it form the basis of, or be relied on in connection with, any contract or investment decision. Certain statements in this presentation about the Company’s current and future plans, expectations and intentions, results, levels of activity, performance, goals or achievements or any other future events or developments constitute forward-looking statements. The words “may”, “will”, “would”, “should”, “could”, “expects”, “plans”, “intends”, “trends”, “indications”, “anticipates”, “believes”, “estimates”, “predicts”, “likely” or “potential” or the negative or other variations of these words or other comparable words or phrases, are intended to identify forward-looking statements. Forward-looking statements are based on estimates and assumptions made by the Company in light of its experience and perception of historical trends, current conditions and expected future developments, as well as other factors that the Company believes are appropriate and reasonable in the circumstances, but there can be no assurance that such estimates and assumptions will prove to be correct. Many factors could cause the Company’s actual results, level of activity, performance or achievements or future events or developments to differ materially from those expressed or implied by the forward-looking statements, including, without limitation, the following factors, which are discussed in greater detail in the final long form prospectus of the Company dated July 31, 2013 (the “Prospectus”) under the sections entitled "Forward-Looking Statements" and "Risk Factors" in the Prospectus: expectations and plans for future growth, including expansion into existing and new markets and other forms of power generation and acquisition activities, including acquisition activities involving TransAlta Corporation (“TransAlta”); the need for additional capital and the expected sources of, and access to, such capital; the availability of sufficient liquidity for future growth and payment of dividends to shareholders; possible changes in the regulatory regimes of the jurisdictions in which the Company operates or intends to operate; the Company’s expectations regarding the ability of TransAlta to operate the Company’s renewable assets effectively; expectations for the growth in demand for electricity in Canada and the U.S.; the possibility of the transfer of future assets held by TransAlta to the Company; the Company’s expectations regarding the availability of industry consolidation opportunities in the future; expectations in relation to the effect of government regulation, incentives and taxation regimes on the Company’s revenues, expenses and cash dividends; expectations in relation to the cost competitiveness of renewable power relative to other sources of power generation; expectations for the retirement of aging energy facilities and the development, construction or operation of new renewable energy facilities including TransAlta’s involvement in sourcing opportunities for the Company; the Company’s expected dividend policy and the amounts expected to be paid under that policy; and expectations regarding TransAlta’s continued ownership of Common Shares. The purpose of the forward-looking statements is to provide the reader with a description of management’s expectations regarding the Company’s financial performance and may not be appropriate for other purposes; readers should not place undue reliance on forward-looking statements made herein. Furthermore, unless otherwise stated, the forward-looking statements contained in this presentation are made as of the date of this presentation, and the Company has no intention and undertakes no obligation to update or revise any forward-looking statements, whether as a result of new information, future events or otherwise, except as required by applicable securities regulations. The forward-looking statements contained in this presentation are expressly qualified by this cautionary statement. The Company has obtained the statistical data, market research and industry data presented in this presentation from a combination of government and other industry publications and reports and the estimates of management. Such data involve risks and uncertainties and are subject to change based on various factors. See “Notice to Investors - Market Data” in the Prospectus. This presentation makes reference to certain non-IFRS measures, including Adjusted EBITDA and cash available for distribution. These measures are not recognized measures under IFRS, do not have a standardized meaning prescribed by IFRS and are therefore unlikely to be comparable to similar measures presented by other companies. For more information relating to the non-IFRS measures, see “Notice to Investors - Non-IFRS Measures” and “Selected Historical Financial Information” in the Prospectus. Copies of the Prospectus are available on SEDAR at www.sedar.com.
One of the Largest Publicly-Traded Renewable Companies in Canada Wolfe Island, ON Upper Mamquam, BC • 28 • 1,112 • $166 • $86 Pingston, BC New Richmond, QC • renewable power generation facilities • megawatts installedgenerating capacity • million in pro formaadjusted EBITDA • million estimatedannual dividend Summerview 2, AB Blue Trail, AB • High Quality Diversified Portfolio • 5 Operating Regions Bone Creek, BC Kent Hills, NB • Alberta • 4 hydro • 21 MW • 10 wind • 417 MW • British Columbia • 4 hydro • 77 MW • Ontario • 4 hydro • 7 MW • 3 wind • 398 MW Bone Creek 19MW • Quebec • 1 wind • 68 MW Upper Mamquam 25MW Cowley North 20MW Pingston 23MW Summerview Two 66MW New Richmond 68MW Macleod Flats 3MW Akolkolex 10MW Blue Trail 66MW Soderglen 35MW Summerview One 70MW Taylor Hydro 13MW Sinnott 7MW McBride Lake 38MW Kent Hills One 80MW Castle River 44MW Kent Hills Two 45MW Ardenville 69MW Misema 3MW Belly River 3MW St. Mary 2MW Waterton 3MW • New Brunswick • 2 wind • 125 MW Moose Rapids 1MW Appleton 1MW Galetta 2MW Wolfe Island 198MW Melancthon One 68MW Melancthon Two 132MW
Premier Renewable Company • Scale and diversification underpinned by high quality assets • Low-risk portfolio consisting entirely of operating assets with fully contracted investment-grade counterparties • Multi-faceted growth strategy with potential access to >1,000 MW pipeline • Conservative payout ratio and financial leverage • Long-term alignment with TransAlta as sponsor and majority shareholder Predictable, Stable Cash Flow SupportsAttractive Dividend Yield Soderglen, 35 MW 4
Canada’s Largest Generator of Wind Power Operating Wind Capacity in Canada (Net MW) 1,107 Source: CanWea June 2013 & company websites Competitive Advantages of Unrivaled Scale
Operational & Commercial Strategy Waterton, 3 MW 6
Diversified Asset Platform Across 5 Operating Regions Estimated Net Annual Generation (GWh) 6%British Columbia 14%Hydro 10%New Brunswick 41%Alberta 10%Quebec 33%Ontario 86%Wind Combination of Wind and Hydro Favours Stable Cash Flow
Operational Excellence Proven technology from top wind equipment manufacturers 24/7 capability to operate remotely from centralized location Performance and equipment monitoring from centralized operations diagnostic centre Experienced operations and engineering team High Wind Fleet Availability and Low Operating Costs
100% Operating Assets with Established History Historical & Expected Production (GWh) 3,207 2,982 3,059GWh Estimated NetAnnual Production1 5.8years weighted average operating history 96.3% 2012 wind fleet availability 2012 2011 Adjusted for assets not yet reaching full production Reported Production Management estimates based on a near term base case production scenario, where there is an equal chance of higher or lower actual net annual generation, and are therefore subject to potential uncertainties. Predictable Production with No Development Risk
100% Contracted with Investment-Grade Off-Takers Government Backed Entities • Average Contract Life of 17 years 10%AAA 37%BBB– 33%AA– 4%BBB+ Sponsor 16%A+ Diversification Reduces Risk
Growth Strategy Three Sisters, 3 MW 11
Renewable Power: The Fastest Growing Power Segment Growth Focus: • Consolidate fragmented industry • Acquisitions of assets from TransAlta • Expansion into other markets and technologies Le Nordais, 99 MW Experience to Execute on Multi-Faceted Growth Strategy 12
Sponsor with a Proven Track Record in Renewables Proven Renewable Asset Growth (MW) 2,212 100years 176% increase • renewable operating experience 9,051MW 801 • generating capacity 80 -85% 2000 2013 • retained interest – intention to remain majority shareholder Majority Shareholder Fully Aligned with Investors
Renewables are One of the Fastest Growing Power Sources Growth in Renewable Power Generation (TWhs) Growth Drivers 72% increase in renewables 39% increase in renewables 2010 2035 2010 2035 Canada U.S. Sources: Annual Energy Outlook 2013 – EIA and Canada's Energy Future: Energy Supply and Demand Projections to 2035 - NEB, November 2011. Positioned to Capitalize on Significant Growth
Potential Acquisitions from TransAlta 813 MW of Hydro Assets 99 MW of Contracted Wind Assets 164 MW of Geothermal Assets 15
Growth Criteria • Assets with proven operating history • Long-term PPA contracts • Investment-grade counterparties • Familiar technologies/suppliers New Richmond, 68 MW Consistent Risk Profile with Existing Portfolio 16
Proven Management Team Extensive Industry and Growth Experience
Board of Directors * Independent Strong and Experienced Independent Directors
Financials St. Mary, 2 MW 19
Cash Available for Distribution ($ millions) 69% 83% $86M in estimated Annual dividends EstimatedAdjusted EBITDA LTM ending March 31, 2013 Deduct: Interest Expense Deduct: Maintenance Capital Expenditure Deduct:Cash Taxes Estimated Cash Flow Available for Distribution Prior to Debt Principal Payments Deduct: Debt Principal Payments Estimated Cash Flow Available for Distribution After Debt Principal Payments Prudent Payout Ratio of 83% After Debt Principal Payments
Financial Strength Wolfe Island, 198 MW Debt to EBITDA of 3.5X Conservative payout ratio Reimbursement based G&A Model Access to capital markets Flexibility and Discipline 21
Investment Highlights • Scale and diversification underpinned by high quality assets • Low-risk portfolio consisting entirely of operating assets with fully contracted investment-grade counterparties • Multi-faceted growth strategy with potential access to >1,000 MW pipeline • Conservative payout ratio and financial leverage • Long-term alignment with TransAlta as sponsor and majority shareholder • Predictable, Stable Cash Flow Supports Attractive Dividend Yield Castle River, 44 MW 22