Download
1 / 20
240 likes | 465 Vues
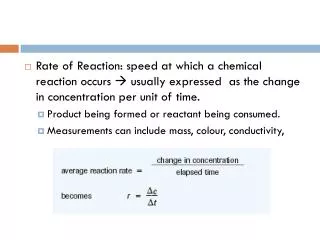
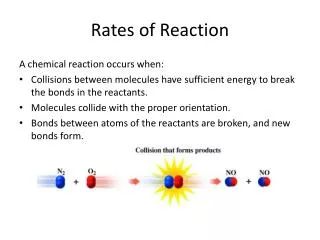
Measuring rates of reaction. Measuring rates. The rate of a reaction is the rate of change of concentration with time . Δ C. Rate =. Where Δ = difference. Δ t. There are two ways of measuring the rate;. 1) The disappearance of a reactant. 2) The appearance of a product.

E N D
Measuring rates The rate of a reaction is the rate of change of concentration with time. ΔC Rate = Where Δ = difference Δt There are two ways of measuring the rate; 1) The disappearance of a reactant. 2) The appearance of a product.
Using tangents to find rates. At any given time the reaction rate can be calculated from the gradient of the tangent of the curve. Δc Gradient = Δt Δc Δt
Note how the rate decreases with time. The slope of the curve is steeper at the beginning, when the rate is greater. The curve becomes shallower as the rate decreases.
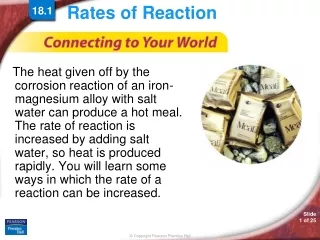
Measuring loss of mass The gas produced is lost lowering the mass. Eg; The reaction of calcium carbonate with acid. Some reactions can be followed by recording the mass at regular time intervals.
Collecting gas If a reaction produces a gas its volume can be measured at regular time intervals. Eg; Hydrogen peroxidedecomposes to form oxygen with a manganese dioxide catalyst.
An excess of marble chips were allowed to react with 100ml of 0.1 mol/dm3 HCl and the gas collected; • Plot these data, label as A. • On your graph sketch and explain the result of repeating the experiment using; • B 50ml of 0.1mol/dm3HCl with marble chips. • C 50ml of 0.2mol/dm3HCl with marble chips. • D 50ml of 0.1mol/dm3 HCl with marble powder. Assume volumes remain contstant.
Measuring colour changes - colourimetry • If one of the reactants, or products, is coloured the rate of reaction can be followed by the absorption or transmission of light. • This is measured using a colourimetre. • Light of a particular wavelength (colour) is passed through a substance onto a light sensitive cell.
Colorimetry The concentration of a coloured substance can be measured using a colorimeter. The transmission or absorbance is read off the scale. The sample is placed into a cuvette. The wavelength is set.
The sample is put into a cuvette. The absorption, or transmission, is read off the scale. The correct filter is choosen. The machine is zeroed using a blank. Colourimetry
The filter should let through only the light that is absorbed by the coloured solution. • Eg; A blue substance absorbs yellow light. • Yellow is its complementary colour, and so a yellow filter must be used. • Conversely for a yellow substance a blue filter is used. • Similarly for a Green substance a magenta filter is used. • For a Red substance a cyan filter.
Beer-Lambert’s Law • Colourimetry assumes that; • Absorbanceάconcentration • But this is only true within certain limits. • If the concentration is too high absorbance will be independent. • To determine the limits of this technique the absorbance at different concentrations must be plotted as a calibration curve.
A calibration curve Above 0.3 mol/dm3 absorbance is no longer άconentration, so the solution has to be diluted until it will give an absorbance on the straight line. Absorbance ά concentration between 0 – 0.3 mol/dm3
Measuring conductivity If a reaction involves different numbers of ions it can be followed by measuring the conductivity of the solution.
Destructive analysis • Samples, known as aliquots, are removed from the reaction mixture at regular time intervals. • The reaction is quenched (stopped) • Then either the concentration of a product, or a reactant, is determined by titration. • In the process reactant/product is destroyed.
Eg; The reaction between propanone and iodine catalysed by protons. CH3COCH3 + I2 → CH2ICOCH3 + HI Propanone, iodopropanone and HI are all colourless. Iodine is yellow/brown
[Iodine] can be analysed by titration against sodium thiosulphate., giving colourless products. 2S2O32- + I2 →S4O62- + 2I- NB aliquots become increasingly paler as the reaction proceeds.
It is difficult to distinguish the end point so starch is used as an indicator. So long as iodine is present the solution will be blue/black. At the end point it will be colourless.