Download
1 / 35
440 likes | 763 Vues
Global Strategic Management. Country Attractiveness Hadi Satyagraha, Ph.D. Country Attractiveness. A function of : Market prospects Competitive context Operating risks Two fundamental questions : Is business likely to generate a return equal or higher than the cost of capital?

E N D
Global Strategic Management Country Attractiveness Hadi Satyagraha, Ph.D.
Country Attractiveness • A function of : • Market prospects • Competitive context • Operating risks • Two fundamental questions: • Is business likely to generate a return equal or higher than the cost of capital? • Are the risks acceptable to the shareholders and employees?
Risks and Opportunities High High Risk High Return High Risks Highly Attractive Opportunities Low Risk Low Return Low Attractiveness Low Low High Risks
Market Opportunities Market: . Size . Growth . Customer quality Resources: . Critical source of: . Personnel . Raw materials . Components . Labor . . Technology . Learning . Quality of infrastructure: . Location Competition: . Intensity of rivalry . Entry barriers . Bargaining power of buyers and suppliers Country Attractiveness Incentives: . Taxes . Subsidies . Infrastructure . Government contracts
Quality of Demand • Segmentation of population based on income per capita: • Top end • Middle class • Higher low end • Lower end
Industry Structure New Entrants Rivalry Suppliers Buyers Substitutes
Resource Endowment • Natural resources: • Minerals • Forestry • Marine • Human Resources: • Quality (Indonesia: low) • Cost (Indonesia: low) • Infrastructure: • Communications and logistics • Support industries
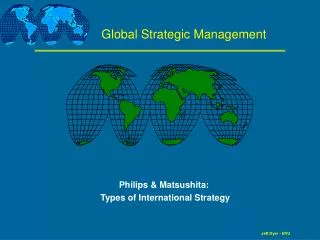
Porter’s Diamond Framework Context Factors Conditions Demand Conditions Related & Supporting Industries
Country Risk Analysis Political Risks: . Shareholder exposure . Employee exposure . Operational exposure Economic Risks: . Growth . Inflation . Exchange rates Competitive Risks: . Infrastructure . regulations Country Risks Operational Risks: . Infrastructure . regulations
Country Risk:China and India Political Risks China India Economic Risks Competitive Risks Operational Risks
Globalization Factors • Economic integration: • Trade • FDI • Personal contacts: • Telephone • Travel • Remittances • Technological connectivity: • Internet users • Internet hosts • Secure servers • Political engagement: • International organizations • UN Peacekeeping • Treatises • Government transfers
Globalization Index Econ Pers Tech Pol • Singapore v v • Switzerland v v v • United States v • Ireland v v v • Denmark v v v v • Canada v v v • Netherlands v v • Australia v • Austria v v • Sweden v v
Top 25 FDI Confidence Index 2004 2005 2004 2005 China1 1 Canada 16 21 United States 2 3 Brazil 17 7 India 3 2 Singapore 18 18 United Kingdom 4 4 Hungary 19 11 Germany 5 9 Thailand 20 20 France 6 14 South Korea 21 23 Australia 7 8 Mexico 22 16 Hong Kong 8 10 Indonesia 23 Out Italy 9 19 Netherlands24 Out Japan 10 15 Taiwan25 Out Russia 11 6 Turkey29 13 Poland 12 5 Dubai/UAE 22 Spain 13 17 CentralAsia 27 24 Czech Republic 14 12 Romania42 25 Malaysia 15 Out
5 Most Important Drivers • Lower R&D costs • Quality labor force • IP protection • Quality of university and research centers • Regulatory environment
Conclusion • China, India, and Eastern European reached new heights in terms of country attractiveness • Drivers of FDI in these regions are: • Low cost • Higher quality labor force • More reliable property rights regimes • Educational and IT infrastructures • Business models: • Joint venture: R&D and knowledge-related • Third party outsourcing: IT, call centers, and distribution & logistics
Global Strategic Management Location Attractiveness Index 2004 A.T. Kearney
Introduction • Potential location for offshore services • Diversify risks and tap into global talent • Viability of countries based on: • Financial structure • People skills and availability • Business environment
Attractiveness Index 2004 FinancialBusiness EnvPeople • India 3.72 1.31 2.09 • China 3.32 .93 1.36 • Malaysia 3.09 1.77 .73 • Singapore 1.47 2.63 1.36 • Philippines 3.59 .92 .94 • Thailand 3.44 1.19 .57 • Vietnam 3.65 .70 .35
People Skills and Availability (p6) • India • China • Singapore • Philippines • Malaysia • Thailand • Vietnam
Business Environment (p10) • Singapore • Malaysia • India • Thailand • China • Philippines • Vietnam
Financial Structure (p13) • India • Vietnam • Philippines • Thailand • China • Malaysia • Singapore
Global Strategic Management FDI Confidence Index 2004 A.T. Kearney
Summary • Surveys of CEOs, CFOs of 1000 largest firms (70% of global FDI) • On 65 countries receiving more than 90% of global FDI flows • Tracking impact of political, economic and regulatory changes, and preferences of leading companies
FDI Confidence Index (p3) • China 2.03 • India 1.40 • Hong Kong .99 • Japan .97 • Malaysia .92 • Singapore .91 • Thailand .87 • Indonesia .80
China Advantage: Market size Market growth Access to export market Government incentives Production costs Infrastructure Stability Quality of loife Tax regime Competitor presence Consumer sophistication India Advantage: Highly educated workforce Management talent Rule of law Transparency Cultural barriers Regulatory environment Availability of MA targets China versus India (p4)
Global Developments (p7) • Recovery of US economy • Dollar volatility • Overheating of China’s economy • Trade initiatives • Government regulations • Corporate governance issues • Terrorism • Rising interest rates
Reasons for Not Off-shoring (p10) • Higher labor skills • Better infrastructure • Proximity to consumers • Maintain organizational control • Less risks • Safeguard IP • Cultural affinity
Most critical risks (p12) • Government regulations • Country financial risks • Currency/interest rates volatility • Political/social disturbances • Corporate governance issues • Absence of rule of law • Theft of IP • Terrorist attacks
High Risk Countries • Brazil 35% • China 23% • Mexico 21% • India 17% • Poland 8%
Greatest Risks in China • Legal/regulatory environment • Corruption • IP rights • Foreign exchange control • Political reform • Cultural adaptability • Protectionist policy • Unreliable local partners
Greatest Risks in India • Bureaucracy • Political stability • Maintaining cost advantage • Physical infrastructure • Geopolitical risks: Pakistan • Trader barriers • Transparency • Poverty
Greatest Risks in Indonesia • Bureaucracy • Poor infrastructure • Shaky financial systems • Fragile political situation • Rampant corruption • Terrorist attacks • Separatist violence