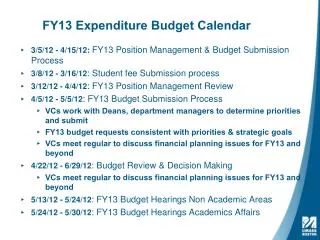
Budget Calendar (Revised)
Revised FY 2007 & Proposed FY 2008 Operating & Capital Budgets Retail Rates Committee January 4, 2007. Budget Calendar (Revised). Budget Request Summary. Revised FY 2007 operating budget totals $311.2 million Proposed FY 2008 operating budget totals $341.2 million

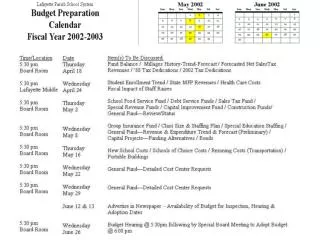
Budget Calendar (Revised)
E N D
Presentation Transcript
Revised FY 2007 & Proposed FY 2008 Operating & Capital BudgetsRetail Rates CommitteeJanuary 4, 2007
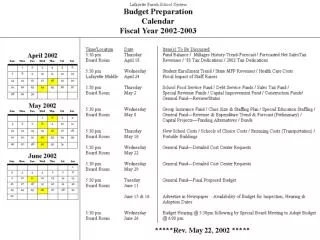
Budget Calendar (Revised)
Budget Request Summary • Revised FY 2007 operating budget totals $311.2 million • Proposed FY 2008 operating budget totals $341.2 million • Proposed FY 2008 water and sewer rate increase of 7.5 percent • Proposed 2008 PILOT/ROW fee increase of approximately 6.8 percent, or $0.03 per Ccf • Capital Budget • Lifetime Budget totals $5.1 billion1 • Disbursements Budget totals $2.2 billion (FY 2006 – 2015)2 • Authority Request totals $446.6 million3 1Lifetime budget includes total budgeted costs for all activities planned from the inception of the project until its completion; this includes all activities whether they pre-date, or extend beyond the current 10-year CIP. 2Capital Improvement Program (CIP) Disbursements Budget projects disbursements for various projects by fiscal year. Contingencies are not included when calculating disbursement budgets 3Appropriations Authority – As part of WASA’s enabling legislation, Congressional appropriations authority is required before any capital design or construction contract can be entered into.
FY 2006 – 2015 CIP by Project Service Area (Cash Disbursements)
Major Assumptions (Reference Section III, Operating Budget Book, for comprehensive discussion of budget assumptions) • Board Financial Policies • Rate setting • Debt coverage • Reserves • Revenue Increases • 5 percent increase in retail revenues for remaining large commercial & federal meter installations • 1 to 3 percent increase in wholesale customers revenues from FY 2008 – 2015 in line with increasing cost of operations • Reduced consumption due to conservation of 1 percent annually in all classes
Major Assumptions - continued • Interest rate assumptions (Investments) • Based on current interest rate environment, interest projections conservatively assume a 4.0 percent earnings rate in FY 2007 and FY 2008 • Beyond FY 2008, interest rates are assumed at 5.0 percent • Rate stabilization fund • $58.5 million balance fully utilized by FY 2012 • Utilize $2.5 million in FY 2007 and $17.8 million in FY 2008 • Operation and maintenance (O&M) expenditure increases • Debt service, the fastest growing area of expenditure in the 10-year plan, grows at an annual rate of 14 percent • All other O&M expenses projected to grow at an average annual rate of 3.5 percent, due to IIP savings
Major Assumptions - continued • Debt Service • Expect to issue new debt in summer / spring 2007 • Start to utilize Commercial Paper Program in second quarter FY 2007 • Interest rate for new bond issuance (fixed rate debt) is projected at 6.5 percent; 4.0 percent assumed for variable rate debt
Major Assumptions - Continued • Combined Sewer Overflow Long-Term Control Plan (CSO LTCP) • 20 year plan totals $1.9 billion including inflation ($558 million included in current CIP) • No additional federal assistance, and current rate structure assumptions • Inflation – All project costs are typically inflated at three percent annually to the mid-point of construction. However, due to the exceptional increases in construction costs experienced in the recent past, some near-term projects have been inflated in the range of five to eight percent per annum.
Revenues, Retail Rates & Fees Proposed Retail Rate & Fee Changes • Rate increases are primarily required to fund increasing debt service costs • Proposed 7.5 percent rate increase in FY 2008, or a 0.5 decrease from last years’ plan with rate increases ranging from 8.0 to 9.5 percent thereafter. • Proposed FY 2008 rate increase of approximately 6.8 percent, or $0.03 Ccfs in ROW / PILOT fees to ensure the Authority fully recovers the costs of this District of Columbia fee
Over the ten-year period, total expenditures increase on average by 6.1 percent annually. WASA’s proposed rate increases are primarily required to fund increasing debt service costs. Operations and maintenance expenditures (excluding the payment in lieu of taxes and right of way fee) increase on average by only 3.5 percent annually Debt service expenditures grow at an annual average rate of 14.3 percent. Why Rate Increases Are Needed OPERATING & DEBT SERVICE EXPENDITURES FY 2006 – 2015 ($000’s)
Retail Rate ProjectionsWith and Without Additional Federal Funding for the CSO LTCP
Proposed FY 2008 Changes AVERAGE RESIDENTIAL MONTHLY BILL FY 2005 - 2008 • Water and sewer rate increase of 7.5 percent • Water ($0.15 per Ccf increase) • Current rate - $2.03 per Ccf • Proposed rate - $2.18 per Ccf • Sewer ($0.23 per Ccf increase) • Current rate - $3.06 per Ccf • Proposed rate - $3.29 per Ccf • Right of way / PILOT fee – increase of 6.8 percent to recover full cost of District charge
WASA’s Retail Rates Are Comparable to Other UtilitiesAverage Monthly Residential Bill Comparison(Based on Fall 2006 Rates) • (1) Assumes average residential consumption of 8.33 Ccfs, or 6,231 gallons per month. Ccf= hundred cubic feet, or 748 gallons. • Reflects WASA’s proposed rate and fee changes in FY 2008 while other utilities’ rates are as of summer/fall 2006. However, during this period, it is anticipated that many utilities will take rate actions. The green area indicates the pass-through of the District’s right-of-way/PILOT fee, totaling $3.92 per month (projected FY 2008) and the residential stormwater rate of $0.58 per month.
Emerging Issues – Potential Rate Impact • Ongoing CIP Implementation • CSO Long-Term Control Plan • Blue Plains Internal Improvement Program Review • Governance Study - Implementation • Blue Plains Issues • Chesapeake Bay Agreement changes (TN) • Biosolids hauling and disposal issues • Digesters construction • Sewer System Assessment • Maintenance Requirements (CMOM) • Inclusion of Study Finding in Capital Program • Water Quality • Security and Emergency Preparedness • New baseball stadium • Main and O Site relocation • M Street corridor improvements • New WASA headquarters building