STAT 5101 Foundations of Data Science
260 likes | 1.19k Vues
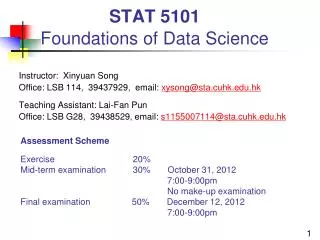
STAT 5101 Foundations of Data Science. Instructor: Xinyuan Song Office: LSB 114, 39437929, email: xysong@sta.cuhk.edu.hk Teaching Assistant: Lai-Fan Pun Office: LSB G28, 39438529, email: s1155007114@sta.cuhk.edu.hk. Assessment Scheme.

STAT 5101 Foundations of Data Science
E N D
Presentation Transcript
STAT 5101Foundations of Data Science Instructor: Xinyuan Song Office: LSB 114, 39437929, email: xysong@sta.cuhk.edu.hk Teaching Assistant: Lai-Fan Pun Office: LSB G28, 39438529, email: s1155007114@sta.cuhk.edu.hk Assessment Scheme Exercise 20%Mid-term examination 30% October 31, 2012 7:00-9:00pm No make-up examinationFinal examination 50% December 12, 2012 7:00-9:00pm
Course Description • This course provides comprehensive coverage of basic concepts of statistics. • Topics include exploratory data analysis, statistical graphics, sampling variability, point and confidence interval estimation, hypothesis testing, other selected topics. • Two computer software: R and Microsoft Excel will be introduced to describe and analyze data.
Learning Outcomes After completing the course, students should be able to • understand basic concepts in statistics; • use various statistical methods and techniques to summarize, present, and analyze data; • read statistical reports and recognize when the quantitative information presented is accurate or misleading ; • use computer software (R and Excel) to analyze data and draw conclusions.
Textbook and Reference Books Textbook Levine, D. M., Stephan, D., Krehbiel, T. C. and Berenson, M. L. Statistics for Managers Using Microsoft Excel 5th Edition. Pearson Prentice Hall, 2008. Reference book • Siegel, A. F. Practical Business Statistics 5th Edition. Mc Graw Hill, 2003. • Agresti, A. and Franklin, C. Statistics: The Art and Science of Learning from Data. 2nd Edition, Pearson Prentice Hall, 2009. • Fraenkel, J., Wallen, N. and Sawin, E. I. Visual Statistics. • 4. Any other textbook for introducing basic statistics.
Organization of Textbook • Presenting and Describing Information • Introduction and Data Collection (Chapter 1) • Presenting Data in Tables and Charts (Chapter 2) • Numerical Descriptive Measures (Chapter 3) • Drawing Conclusions About Populations Using Sample Information • Basic Probability (Chapter 4) • Some Important Discrete Probability Distributions (Chapter 5) • The Normal Distribution and Other Continuous Distributions (Chapter 6) • Sampling and Sampling Distributions (Chapter 7) • Confidence Interval Estimation (Chapter 8) • Hypothesis Testing (Chapters 9-12) • Decision Making (Chapter 17)
Organization of Textbook • Making Reliable Forecasts • Simple Linear Regression (Chapter 13) • Introduction to Multiple Regression (Chapter 14) • Multiple Regression Model Building (Chapter 15) • Time-Series Forecasting (Chapter 16) • Improving Business Process • Statistical Applications in Quality Management (Chapter 18)
Course Outline Chapter I Data Collection and Data Presentation Chapter 2 Numerical Descriptive Measures Chapter 3 Important Discrete Probability Distributions Chapter 4 Important Continuous Distributions Chapter 5 Sampling and Sampling Distributions Chapter 6 Confidence Interval Estimation Chapter 7 Hypothesis Testing: One Sample Tests Chapter 8 Two-Sample Tests Chapter 9 Chi-squared Tests and Nonparametric Tests Chapter 10* Selected topic
Chapter 1Data Collection and Data Presentation • Explain key definitions: Population vs. Sample Primary vs. Secondary Data Parameter vs. Statistic Descriptive vs. Inferential Statistics • Describe key data collection methods • Describe different sampling methods • Probability Samples vs. Nonprobability Samples • Identify types of data and levels of measurement • Use graphical techniques to organize and present data ordered array stem-and-leaf display frequency distribution, polygon, and ogive histogram scatter diagrams bar charts, pie charts
Chapter 2Numerical Descriptive Measures • Mean, median, mode • Range, variance, standard deviation, coefficient of variation • Five-number summary • Box-and-whiskers plot • Correlation coefficient
Chapter 3Important Discrete Probability Distribution • Define mean and standard deviation • Explain covariance and its application in finance • Binomial probability distribution • Poisson probability distribution • Hypergeometric probability distribution • Negative binomial distribution, geometirc distribution, multinomial distribution
Chapter 4 Important Continuous Distributions • Continuous probability distribution • Characteristics of the normal distribution • Using a normal distribution table • Evaluate the normality assumption • Uniform and exponential distributions • Gamma and Weibull distributions
Chapter 5 Sampling and Sampling Distributions • Types of sampling methods • Sampling distributions • Sampling distribution of the mean • Sampling distribution of the proportion • Central Limit Theorem
Chapter 6Confidence Interval Estimation • Point estimate • Confidence interval estimate • Confidence interval for a population mean • Confidence interval for a population proportion • Determine the required sample size
Chapter 7Hypothesis Testing: One Sample Tests • Null and alternative hypotheses • A decision rule for testing a hypothesis • Hypothesis testing • Type I and Type II errors
Chapter 8Two-Sample Tests • Test the difference between two independent population means • Test two means from related samples • Test the difference between two proportions • F test for the difference between two variances
Chapter 9Chi-Square Tests and Nonparametric Tests • Chi-square test for the difference between two proportions • Chi-square test for differences in more than two proportions • Chi-square test for independence • The Wilcoxon rank sum test for two population medians • The Kruskal-Wallis H-test for multiple population medians