Download
1 / 38
380 likes | 580 Vues
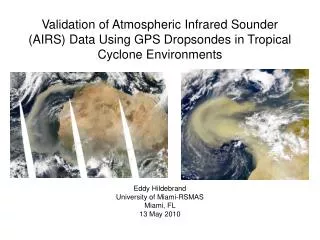
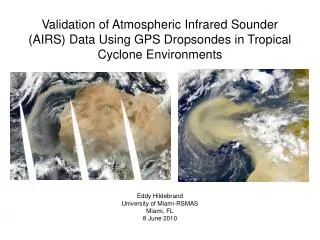
Validation of Atmospheric Infrared Sounder (AIRS) Data Using GPS Dropsondes in Tropical Cyclone Environments. Eddy Hildebrand University of Miami-RSMAS Miami, FL 8 June 2010. Objectives.

E N D
Validation of Atmospheric Infrared Sounder (AIRS) Data Using GPS Dropsondes in Tropical Cyclone Environments Eddy Hildebrand University of Miami-RSMAS Miami, FL 8 June 2010
Objectives • Validate the performance of AIRS in measuring temperature and moisture profiles in the environments surrounding Tropical Storms Irene (2005) and Debby (2006) and Hurricane Helene (2006) • Temporally average AIRS data to show interseasonal and intraseasonal variability in tropical North Atlantic moisture • Compare AIRS moisture data with other satellite measurements such as SSM/I • Examine the relationship between dry air and intensity change of tropical cyclones • Dry air from Saharan Air Layer (SAL) and/or mid-latitude origins • Also consider SHIPS wind shear and SST
Defining the SAL Occasional dust outbreaks (every few days) originating over Africa Most frequent in June/July (Dunion 2010, Dunion and Marron 2008) Propagate across the Atlantic at nearly the same speed as tropical waves Figures: Dunion 2010
Figure: Dunion and Velden (2004) - Black line: Jordan (1958) Mean Tropical Sounding - Solid blue line: mean moist tropical/non-SAL sounding - Dashed blue line: mean SAL sounding From GPS dropsondes launched in environments surrounding four tropical cyclones
Tracking the SAL VIS, IR, and MW satellites (GOES, Meteosat, SSM/I, AIRS) Radiosondes and GPS dropsondes – sparse coverage (7.3 micron IR channel; sensitive to low & mid level moisture) Figures: CIMSS
Tracking the SAL • Air Resources Laboratory (ARL) Hybrid Single Particle Lagrangian Integrated Trajectory (HYSPLIT) model • Uses NCEP/NCAR reanalysis • Backward trajectories indicating air parcel origins • Navy Aerosol Analysis and Prediction Scheme (NAAPS)
Atmospheric Infrared Sounder - AIRS Aboard Aqua satellite (part of A-Train) launched in May 2002 2378 spectral channels Expected performance ability (Tobin et al. 2006): Temperature – 1K RMS differences in 1km layers RH – 20% in 2km layers Vertical profiles ~50km horizontal resolution with 28 vertical levels (Wu et al. 2006) Courtesy: www.nasa.gov
AIRS Dust Flag • Unitless integer indicating presence of dust • Comparison of radiance values • Only valid in clear atmosphere over ocean • Clouds above the dust lead to a failed algorithm
AIRS/GPS Dropsonde Comparison • “Match” individual AIRS profiles with NOAA/HRD GPS dropsondes from Tropical Storms Irene (2005) and Debby (2006) and Hurricane Helene (2006): • Spatial distance (< 50 km) • Time difference (< 3 hr) • Error flag (< 3584) • Why a strict spatial distance? • Horizontal moisture gradients along the SAL edge are high Figure courtesy: CIRA
AIRS/GPS dropsonde temperatures compare well over most of the troposphere • Biggest issue is with T inversion at SAL base – maybe due to AIRS vertical resolution?
Mixing Ratio Histograms & PDF 850 hPa 1000 hPa • TS Irene (7 August 2005) • Bimodal peak in MR at 850 hPa (SAL and moist tropical)
35 GPS dropsondes released in SAL environments • 84 matching AIRS profiles • Greatest GPS dropsonde/AIRS mixing ratio difference: ~3.1 g/kg at 850 hPa
5 moist tropical GPS dropsondes • 16 AIRS matching profiles • Small sample size (SALEX missions, focus was on SAL regimes)
Sensitivity to Distance Criterion 25 km • Initially 50 km between AIRS profile and GPS dropsonde • What about 25 km? 75 km? Do AIRS statistics change? 75 km 50 km
Total Precipitable Water • Amount of water vapor contained in a column of air extending from the surface to the top of the atmosphere • Vertical integration of MR • ~99.5% of atmospheric moisture is below 250 hPa (~92% below 500 hPa) (Dunion 2010)
AIRS Mixing Ratio Cross-sections • AIRS struggles with moisture retrievals near TCs (and in high terrain) so why use it? • - Vertical distribution of moisture
AIRS Mixing Ratio & TPW Climatology June October All AIRS MR values from 0-40N 15-90W June-October August
What if we remove the mean? June 16-30 Figure: Dunion (2010) August
Aug 2005 Aug 2006 -Aug 2005 has more moisture in central & western Atlantic than Aug 2006 Aug 05 Aug 06
Sep 2005 Sep 2006 • Sep 2005 has more moisture in Caribbean and less in NE Atlantic than Sep 2006 Sep 05 Sep 06
Consider Aug 05 & Sep 06 and the difference field between the two months Aug 05 drier in NE Atlantic – stronger subtropical high? Aug 2005 Sep 2006
Jun Jul Aug Sep Oct
Jun Jul Aug Sep Oct
Summer 2005 Summer 2006 • Summer 2005: more moisture in western Atlantic basin • Summer 2006: higher standard deviation over west Africa
Dry Air and Intensity Change • Named storms within the domain during AIRS lifetime (’03-’08): 57 • Storm days: 327 (176 intensification, 67 steady, 84 weakening) • Exclude days when storms were centered over land • Determine intensity change based on quadrants with dry air • Dry air defined as TPW < 45 mm (Dunion 2010) • Radius of 400 km from storm center (Shu and Wu 2009) • Intensity change based on dry air and shear/SST Domain: 5-30N 20-80W
Filtered AIRS Data Remove pixels surrounding cloud-flagged pixels if TPW < 25 mm
NW NW NE NE SW SW SE SE • Filtered AIRS data: • Peaks slightly broader in weakening cases (ex: SE quad) • Peak ~50 mm in all quadrants regardless of intensity change • Sharp tail toward higher values; gradual tail toward lower values
NW NW NE NE SW SW SE SE • Microwave data: • Sharper peaks for intensifying cases • Peaks slightly higher for intensifying cases (~55 mm vs ~50 mm for weakening) • Larger tail toward lower TPW values for weakening cases • Tails much smaller than AIRS data
AIRS - Intensifying MW - Intensifying AIRS - Weakening MW - Weakening • AIRS and microwave TPW histograms: • Peaks sharper for microwave data • Sharper tail toward lower TPW values in microwave data
Dry Air and Wind Shear I W I W Low wind shear (< 15 kt or ~8 m/s): -Intensification more likely no matter how much dry air is present -Likelihood of intensification decreases with increasing dry air High wind shear (> 15 kt or ~8 m/s): -Weakening more likely -Likelihood of weakening increases further when there is more dry air on the east side of the storm
Dry Air and SST I W High SST (> 28C): -Intensification generally more likely -Likelihood of of weakening increases with dry air I W Low SST (< 28C): -Similarities to high SST plot -Storms can still intensify with SST < 28C -Weakening becomes more likely here too with more dry air
Conclusions and Future Work • AIRS can differentiate between a dry (SAL or mid-latitude air) environment and a moist tropical one • Deep convection, especially that associated with tropical cyclones, impacts AIRS moisture retrievals • Comparison of AIRS and GPS dropsonde data suggests AIRS struggles with low-mid level moisture (~3 g/kg dry bias in SAL cases at 850 hPa) • AIRS total precipitable water can be used on individual days and for temporal averaging to determine variability in tropical North Atlantic moisture • AIRS struggles in areas immediately surrounding cloud-flagged pixels – extremely low TPW near the core of tropical cyclones • Relationship between dry air and intensity change suggests that dry air combines with other factors (high shear and/or low SST) to increase the chances of weakening • Expand to other ocean basins – no SAL, but they all have mid-latitude dry air
Acknowledgements • Committee: • Chidong Zhang (chair) • Sharanya Majumdar • Jason Dunion (NOAA/AOML/HRD) • Friends at RSMAS, especially those in MPO, and especially those in MPO who woke up “early” to get here by 11 • Wetlab and award-winning $2 pints Award
References • Dunion, J. P., 2010: Re-Writing the climatology of the tropical North Atlantic and Caribbean Sea atmosphere. J. Climate (Accepted). • Dunion, J. P., and C. S. Marron, 2008: A reexamination of the Jordan mean tropical sounding based on awareness of the Saharan Air Layer: results from 2002. J. Climate, 21, 5242–5253. • Shu, S., and L. Wu, 2009: Analysis of the influence of Saharan air layer on tropical cyclone intensity using AIRS/Aqua data. Geophys. Res. Lett., 36, L09809, doi:10.1029/2009GL037634. • Tobin, D. C., and Coauthors, 2006: Atmospheric Radiation Measurement site atmospheric state best estimates for Atmospheric Infrared Sounder temperature and water vapor retrieval validation. J. Geophys. Res., 111, D09S14, doi:10.1029/2005JD006103. • Wu, L., S. A. Braun, J. J. Qu, and X. Hao, 2006: Simulating the formation of Hurricane Isabel (2003) with AIRS data. Geophys. Res. Lett., 33, L04804, doi:10.1029/2005GL024665. Courtesy: Chidong Zhang